How Everything Connects in Planfix: From Custom Fields to Reports

If you’re just getting started with Planfix, terms like “data tags,” “objects,” and “directories” might sound better suited to accountants, system administrators, or people who genuinely enjoy spreadsheets.
The good news? They’re much simpler than they seem.
Planfix uses these building blocks to simplify your work, not complicate it. Custom fields store the information your business actually needs. Objects represent your business processes. Directories provide consistent values. Data tags capture metrics and business events. Finally, reports turn all that information into insights you can actually use.
In this article, we’ll look at how these pieces fit together using a simple, relatable example: replacing light bulbs. While this may not sound like a groundbreaking digital transformation project, it’s the perfect way to demonstrate how Planfix works as both a configurable CRM and business analytics software.
Replacing a single light bulb might seem straightforward, but what if you were responsible for managing the bulbs in an entire office? Suddenly, you need to know where the bulb burned out, how urgent the replacement is, which model to buy, how many bulbs were used, how much they cost, and how to include those expenses in your reports.
Taking things from a single field to a complete business report is where the real power of Planfix begins.
What Are Custom Fields in a Configurable CRM?
Custom fields make it easy to capture the details that are important to your business processes.
Think about a typical Planfix task. By default, it includes a title, description, assignee, due date, status, and comments. But in real business processes, that’s rarely enough. A maintenance request may need a priority level. A purchase request needs a budget. A business trip requires destinations and travel dates, while a sales opportunity needs a lead source and pipeline stage. Finally, service requests often require a request type and SLA level. To learn more about setting up performance standards, read our guide on What is Service Level Agreement Tracking in Task Management?
Custom fields allow you to store all of this information in a structured way instead of burying it in the task description.
For example, you could add fields such as:
- Replacement Priority
- Repair Type
- Room Location
- Request Reason
- Purchase Amount
- Equipment Type
- Visit Date
- Responsible Department
This is where CRM customization becomes valuable, as it allows you to decide which information should be stored, where it should appear, and how it will be used later.
Think of each custom field as a label you can stick almost anywhere: on tasks, projects, employee profiles, contacts, or documents. Need a “Priority field?” Easy. Want to track “Repair type” or even “Chair color?” That’s possible too. Just don’t overdo it. Otherwise, your task card may end up looking like a twelve-page application form.
In a configurable CRM, custom fields define your CRM data structure. That structure then goes on to become the foundation for filters, reports, automation, and data tags. Once information is stored in dedicated fields, it can be searched, grouped, sorted, counted, and included in reports.
In the end, if everything is buried inside free-text comments, analyzing it becomes much more difficult. Custom fields are the first step toward truly organized business data.
How Objects Help Build Custom Database Software
Objects take CRM customization a step further. While a custom field stores a single piece of information, an object represents an entire business entity or process. In our example, the object could be “Light bulb purchase and replacement.” In another company, it might be a “Repair request,” “Customer order,” Contract approval,” “Business trip,” “Equipment purchase,” or “Support request.”
Think of an object as a container that holds an entire business process. Inside it, you can define fields, statuses, stages, automation, and the rules that govern how the process works.
For the “Light bulb purchase and replacement” object, you might want to track:
- where the bulb needs to be replaced;
- how urgent the request is;
- which bulb is required;
- who is responsible;
- the current stage of the process;
- how many bulbs were replaced;
- the total cost.
Objects make it possible to build custom database software without writing code. Instead of waiting for a developer to create a new table, form, or workflow, you simply configure the business entity you need directly in Planfix.
That flexibility is one of Planfix’s greatest strengths. The platform doesn’t force every company into the same structure. Instead, you can model your own business entities and connect them with tasks, directories, data tags, reports, and automation.
An object is much more than another task card. It forms the foundation of business process tracking, helping you define what happens during a process, which data should be collected, which stages need to be completed, and which results should be measured later.
For example, the “Light bulb purchase and replacement” object might move through several stages, such as:
- New request
- In progress
- Waiting for purchase
- Bulb replaced
- Completed
Meanwhile, adding a field like “Replacement priority” immediately tells employees which requests require urgent attention. This way, they know which light bulbs can survive another day without turning the office into a dramatic walk through a dark hallway.
Using Directories for Business Data Management
Directories are mini databases inside Planfix.
They are designed to store recurring information that needs to be reused across different processes. Let’s say your company maintains lists of light bulbs, materials, services, pricing plans, departments, suppliers, or equipment types. It is better to keep that information in a directory than enter it manually every time.
Let’s go back to our light bulb example.
You could type the bulb name manually each time, entering things like LED 10W, 10-Watt LED, 10W bulb, or 10-watt energy-saving bulb. But a month later, the system could potentially contain multiple versions of the same item. Suddenly, your report will start to resemble a filing cabinet full of mismatched labels.
Having a directory solves this problem because you can create the list of bulbs once and add the required details to each entry, such as:
- Name
- Wattage
- Base type
- Price
- Manufacturer
- Notes
- Inventory code
Employees can quickly select the correct bulb from a predefined list. Meanwhile, the data stays consistent, and reports become much cleaner.
This approach simplifies business data management. Because all of the information is stored centrally, it can easily be reused in tasks, data tags, and reports. If the price of a bulb changes, you simply update it in the directory instead of searching through dozens of tasks and old messages.
Of course, directories are useful for much more than light bulbs. They can store:
- Services
- Pricing plans
- Products
- Materials
- Equipment types
- Expense categories
- Departments
- Branch offices
- Request reasons
- Customer categories
- Work types
With a little effort, each directory can become a reliable source of structured data. You may not notice it working in the background, but it plays an important role in keeping everything organized.
Operational Analytics Inside Daily Workflows
Data tags in Planfix help capture operational data directly inside everyday workflows.
A custom field usually stores a single value in a card, while a data tag is better suited to accumulating multiple records over time. For example, a task may contain one replacement priority, but employees can use data tags to add several entries showing which bulbs were replaced, how many were used, where the work took place, and how much each one cost.
Put simply, a data tag works like a smart calculator built directly into the task. You don’t need to search for a separate spreadsheet. Employees simply enter information as the work happens, and Planfix uses it in reports later.
In our example, a data tag could record:
- Bulb type
- Location
- Quantity
- Unit price
- Replacement date
- Responsible employee
- Work notes
This is operational analytics in practice: data is collected at the exact moment the work is completed instead of as a separate reporting exercise.
An employee replaces a bulb and records the result. Several bulbs are purchased, so another entry is added. Multiple rooms are serviced, and the details are recorded for each one. Planfix can then use all of this information in reports, giving managers a clearer picture of the work being completed, the resources being used, and the costs involved.
This reduces the risk of important data being lost. At the end of the month, no one has to remember what was replaced and where. Nor is there any need to reconstruct the numbers from chats, invoices, or a colleague’s memory. The information is already in the system.
Data tags connect daily operations with CRM analytics. Employees enter information once, while managers gain a broader view of costs, workload, recurring issues, completed work, and performance trends.
How Reporting and Analytics Software Works in Planfix
Reports are where all the internal logic of Planfix becomes visible.
While custom fields, objects, directories, and data tags are useful on their own, their real value appears when the information can be collected, grouped, and presented in a clear format.
For the light bulb replacement process, a report might show:
- Which bulbs were replaced
- How many units were used
- Which rooms required replacements
- How much the work cost
- Which bulb types are purchased most often
- Where requests occur most frequently
- Total spending for a selected period
Once everything is configured, you can open the report without manually updating formulas or rebuilding charts. This way, when a manager asks for a summary that was apparently needed “yesterday,” you don’t have to collect the numbers manually. Instead, you can simply open the relevant report.
This is how reporting and analytics software turns scattered operational activity into a clear management overview.
Business reporting software is especially useful when companies need to monitor expenses, processes, and team performance, including:
- Purchasing
- Equipment maintenance
- Project work
- Service requests
- Customer support
- Business travel
- Financial tracking
- Warehouse operations
- Compliance procedures
To further simplify things, Planfix reports can combine information from different system entities. This matters because it allows properly structured data from fields, directories, and data tags to be analyzed rather than simply stored somewhere inside a collection of tasks.
How Planfix Entities Work Together
| Custom Fields | Store additional business data | Flexible CRM customization |
| Objects | Organize workflows and processes | Better business process tracking |
| Directories | Centralize reusable information | Easier business data management |
| Data Tags | Track operational metrics | Improved operational analytics |
| Reports | Visualize and analyze data | Faster business reporting |
Planfix elements do not work in isolation. Rather, they form a connected system.
Custom fields describe important parameters. Objects define the structure of a process. Directories provide consistent values, and data tags capture operational activity. Finally, reports bring everything together and display the final result.
Together, they turn Planfix into a business data management system where information does not disappear into chats, spreadsheets, or verbal agreements, but it stays organized within one shared workspace.
From Data Tracking System to Business Reports
So far, this might seem a lot like a puzzle. Only in this case, the finished picture is a clear and manageable workflow. Now let’s put everything together.
To make things easy, we’ll continue to use our burned-out office light bulbs analogy.
Let’s build a simple process that covers everything from submitting a request for purchasing or replacing a bulb to generating a report on the completed work.
Step 1. Create the Light Bulb Purchase and Replacement Object
First, create an object called “Light Bulb Purchase and Replacement.”
Then, add a custom list type field named “Replacement priority.”
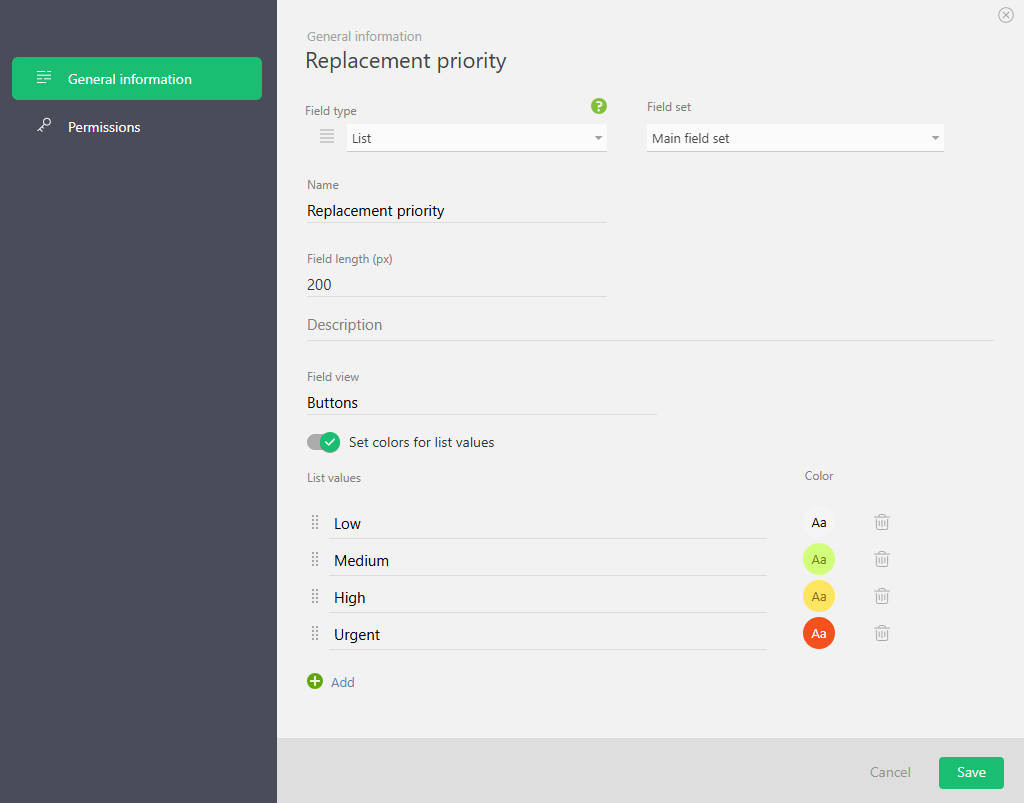
For example, the available values might be:
- Low
- Medium
- High
- Urgent
This way, employees do not simply see a new task, but immediately understand how quickly it needs attention.
Step 2. Add a Bulb Directory
Now let’s create a directory called “Bulb types.”
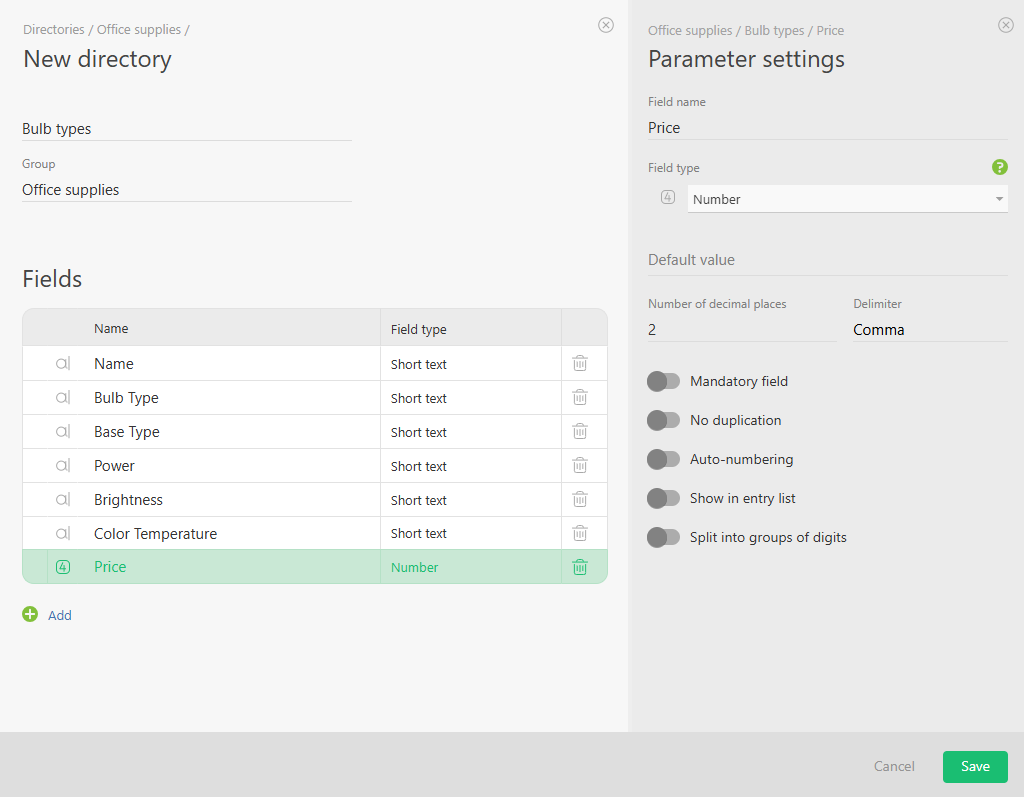
Then add the relevant information for each bulb, such as its name, wattage, price, base type, and other specifications.
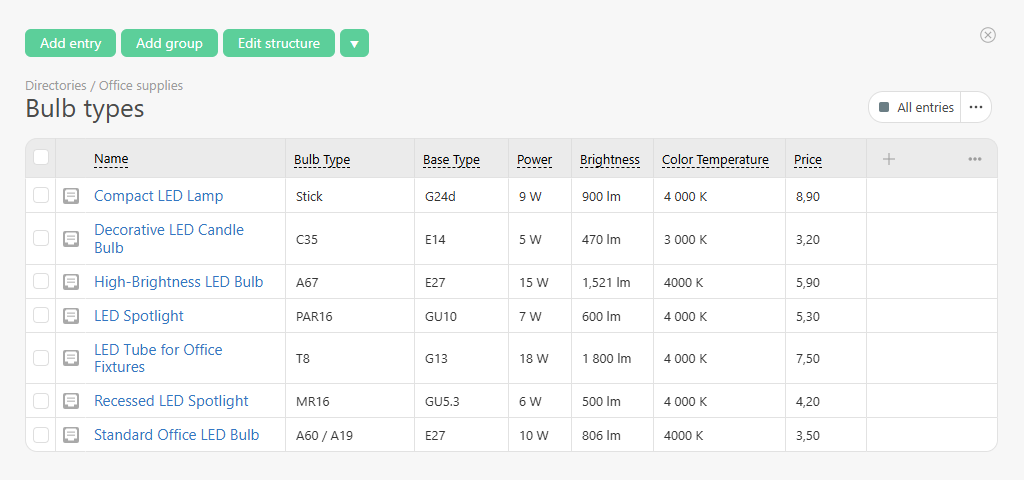
This way, employees no longer need to type bulb names manually, but can simply select the correct model from a predefined list.
Step 3. Create a Data Tag
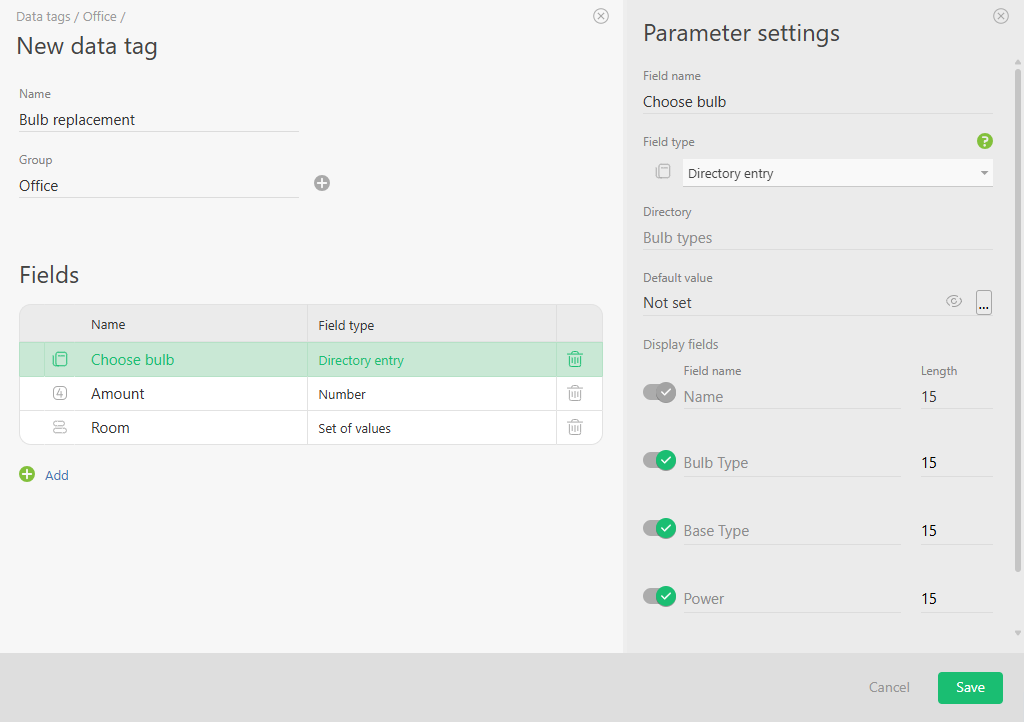
Next, create a data tag and add a field connected to the bulb directory.
This is how the list of bulbs from the directory looks inside the data tag:
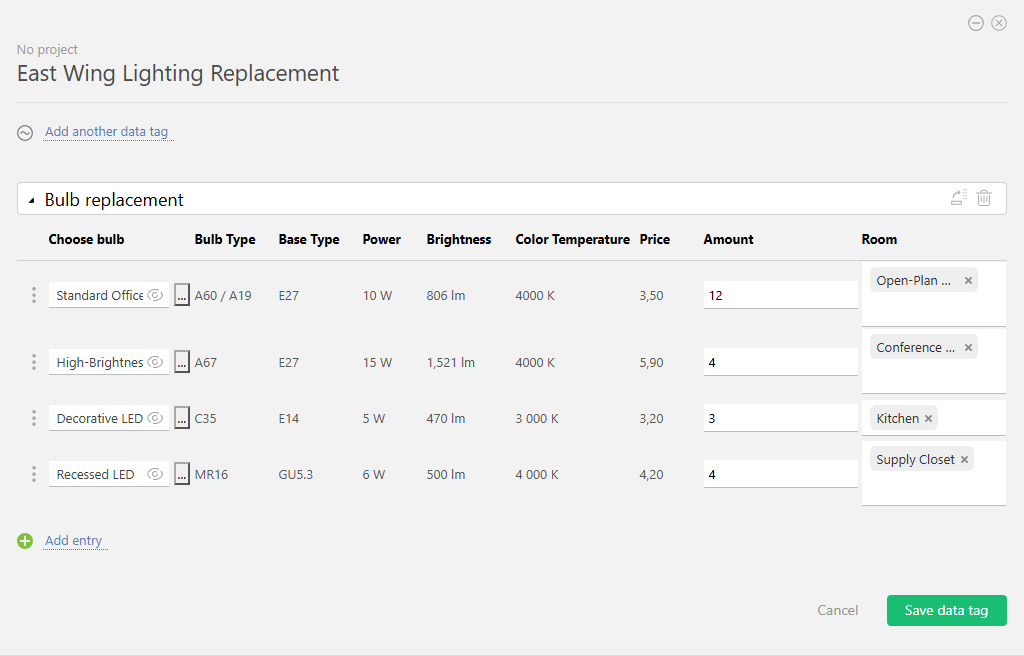
Employees can now easily record which bulbs were used, how many were replaced, and where the work was completed.
Step 4. Manage the Task in the Planner
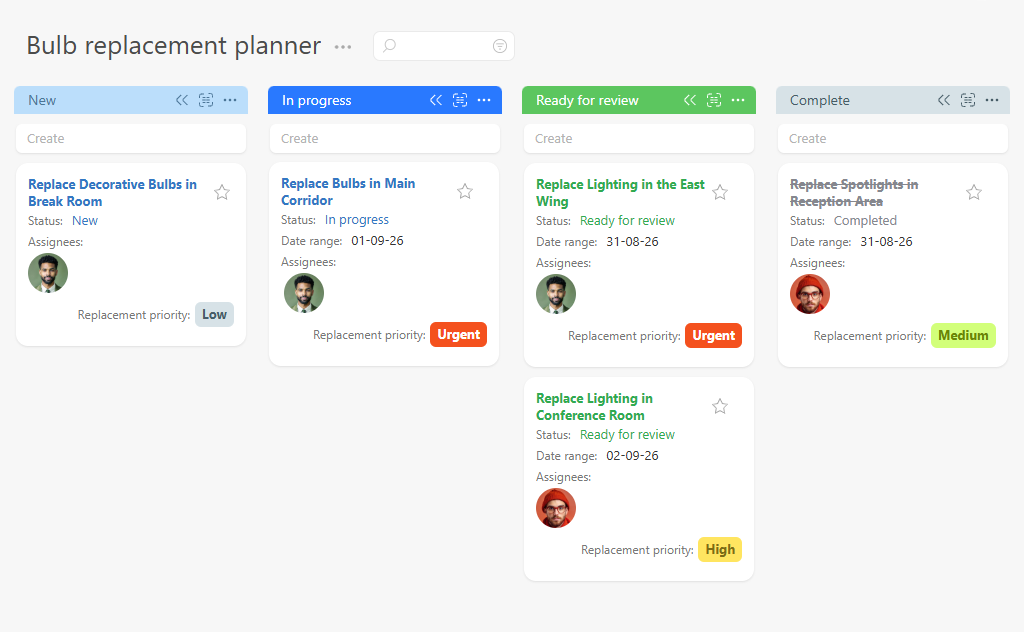
The “Replacement priority” field in the Planner helps employees immediately see where bulbs have gone out and which part of the office needs them replaced first.
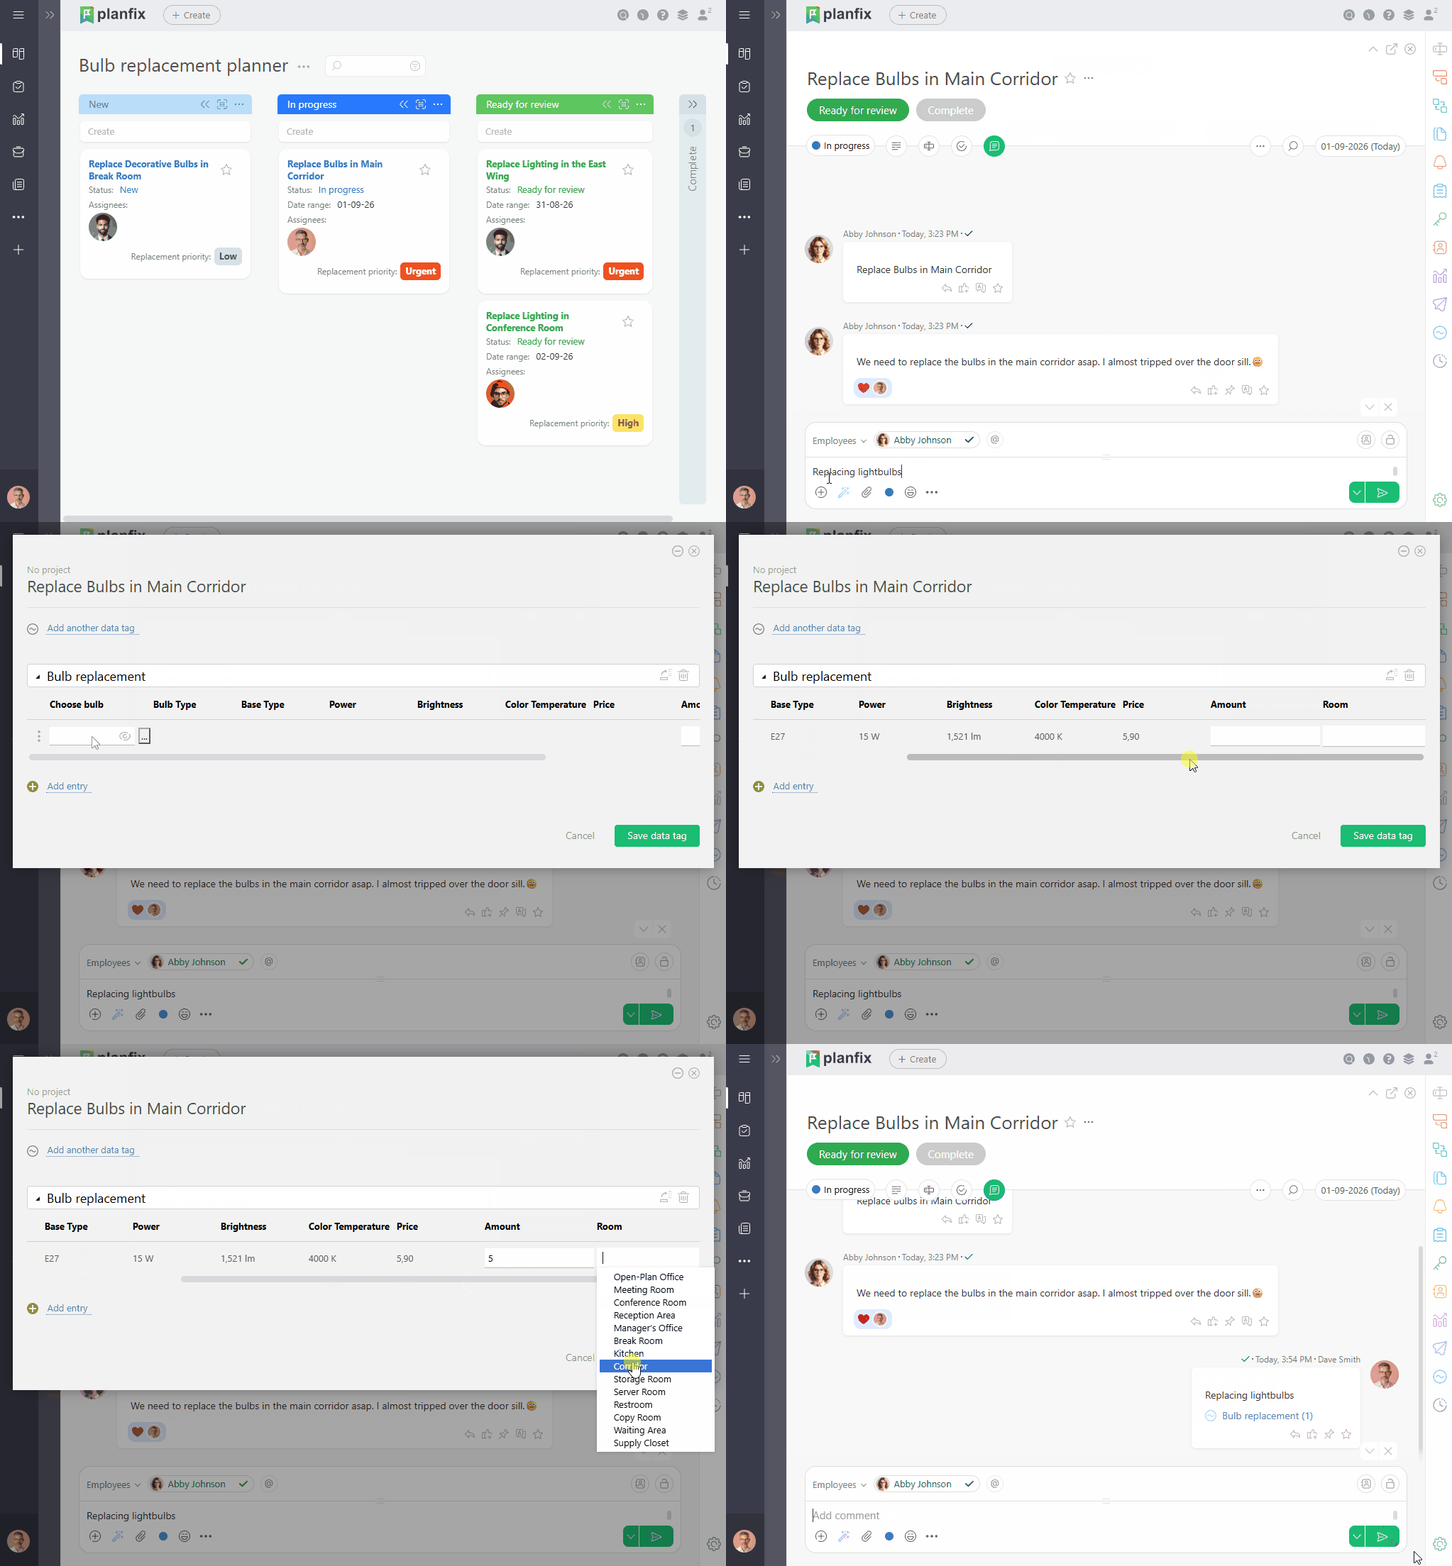
Once the new bulbs have been installed, the employee only needs to record the completed work in the data tag.
Step 5. Generate the Report
And now for the real magic.
The report displays all the data for the selected period, including which bulbs were replaced, how many were used, how much they cost, and where the work was carried out.
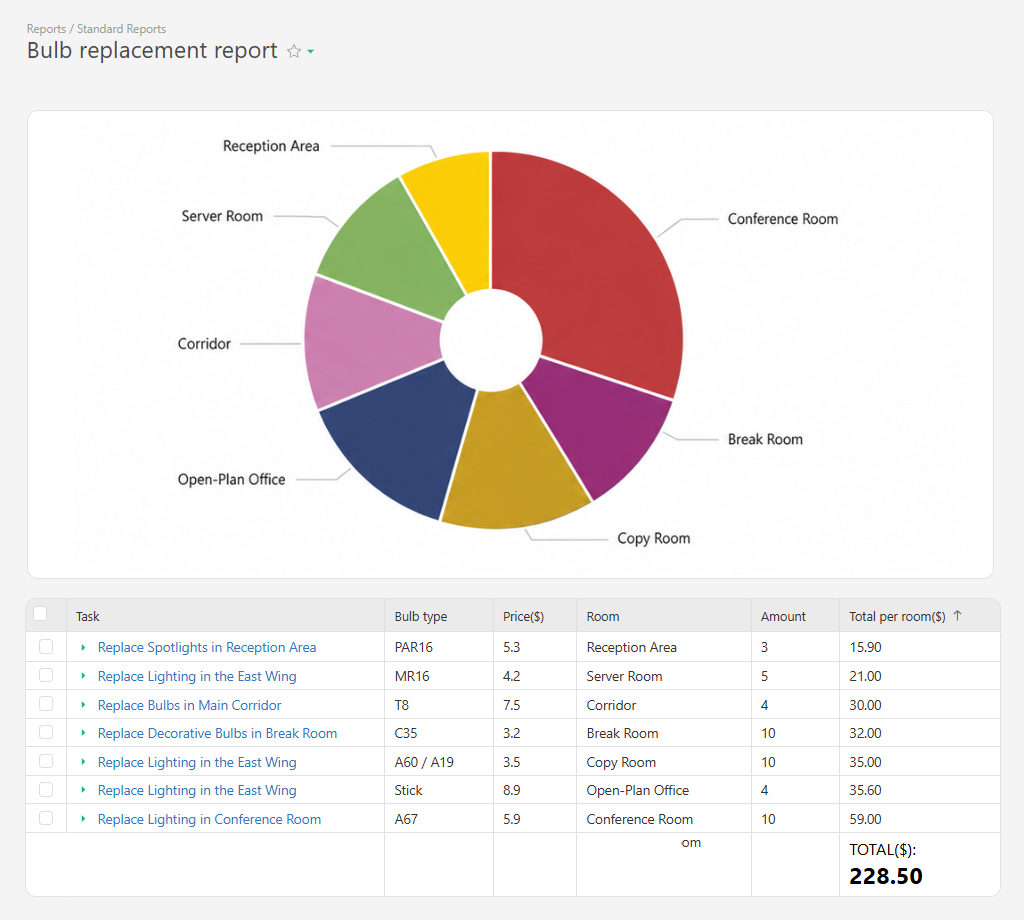
One glance is enough to understand what happened.
The custom field showed where the problem was urgent. The directory provided the correct bulb model, while the data tag captured the completed work. Then, the report turned it all into a clear overview.
This is how a data tracking system becomes a business report. Planfix collects information at every stage of the process and makes it immediately available for analysis.
CRM Analytics for Better Process Visibility
CRM analytics helps businesses see their operations as a connected system rather than a collection of unrelated tasks.
When data is scattered, managers only see fragments: a task in one place, a comment in another, a spreadsheet somewhere else, and an important message buried in a chat. Once that information is connected through custom fields, objects, directories, data tags, and reports, the full picture becomes visible.
The light bulb example may seem overly simplistic, but it showcases how the exact same logic can apply to much more complex processes, such as:
- Equipment purchasing
- Project management
- Profit calculation
- Business travel tracking
- Equipment maintenance
- Request management
- Customer relationship management
- Expense control
- Internal work planning
CRM analytics don’t just help answer the question of “What happened?” but also more important questions, like:
- Where do problems occur most often?
- Which processes take the most time?
- Which expenses are increasing?
- Which tasks keep repeating?
- Where is automation needed?
- Which areas require closer control?
Ultimately, centralized analytics supports faster, better-informed decisions. If a report shows that bulbs are being replaced more often in one room, the real problem may be the electrical system rather than the bulbs themselves. If purchasing costs are rising, the company can review suppliers or usage rates. If requests repeatedly stall at the same stage, the workflow may need to be redesigned.
This is how Planfix helps businesses identify not only individual tasks, but also the patterns behind them.
No Code CRM for Flexible Business Automation
Planfix can be used as a no-code CRM, allowing teams to create processes, objects, fields, directories, data tags, and reports without relying on developers.
This is especially valuable for startups and growing companies whose processes change frequently. Today, you may need to track light bulb replacements. Tomorrow, equipment purchases. The next day, invoice approvals. Later, the same system may need to handle business trips or internal employee requests.
When every change requires a developer, the system becomes slow to adapt. Teams start working around it, and spreadsheets, chats, and manual tracking gradually return.
A no-code CRM works differently. Users can shape the system around real business needs. They can start with a simple workflow, test it in practice, add fields, expand a directory, configure data tags, and build a report when enough information has been collected.
A custom CRM setup does not have to be complicated. In many cases, you only need to understand a few basic relationships:
- What represents the main process object
- Which information should be stored in custom fields
- Which recurring values belong in a directory
- Which activities should be recorded with data tags
- Which metrics should appear in a report
Once this logic is clear, Planfix becomes more than a CRM. It becomes a flexible platform for building and improving business workflows.
How to Create Custom Reports in Planfix
A custom reporting system doesn’t just begin with the report itself, but with a well-designed data structure.
Before creating a report, decide which metrics you want to see. For the light bulb replacement process, these might include:
- Number of replacements
- Monthly expenses
- Bulb types
- Rooms
- Responsible employees
- Trends over time
- Urgent requests
Next, determine where each piece of information should be stored:
- Priority in a custom field
- Bulb type in a directory
- Quantity and price in a data tag
- Room in a task or data tag field
- Period based on the creation or completion date
- Totals calculated in the report
Once the data structure is clear, you can build the report.
The basic setup process looks like this:
- Select the object the report will use.
- Add the required columns.
- Choose which fields and attributes to display.
- Configure grouping.
- Add filters for period, status, object, or responsible employee.
- Configure totals and calculations when needed.
- Save the report for regular use.
The same approach can be used to create custom reports for purchasing, tasks, sales, projects, expenses, service requests, and all other types of business metrics.
The key is not to create a report that attempts to show everything at once. Instead, start with one specific question, such as: “How much did we spend on bulb replacements this month?” or “Which rooms generate the most maintenance requests?”
In the end, the most useful reports answer a clear management question.
CRM Architecture That Connects All Business Processes
CRM architecture in Planfix is built around relationships between system entities.
Rather than a collection of isolated modules, fields, objects, directories, data tags, and reports work together as parts of one system.
An object defines the process while fields add the necessary characteristics. Directories provide standardized values, and data tags accumulate actual operational records. Finally, reports combine the information and present the result.
This architecture makes processes easier to scale.
Today, you can configure a workflow for purchasing and replacing light bulbs. Tomorrow, you can use the same logic for air conditioner maintenance. Before long, you’ll be able to support equipment purchasing, business travel, or document approval. The exact structure may change, but the underlying principle remains the same.
This is especially useful for companies that do not want their operations spread across a dozen disconnected tools. When processes share one system, it becomes easier to manage data, control work, and build reliable reports.
Planfix connects different business processes within a single information environment. It is more than a CRM, task manager, or reporting tool. It connects the work your team does today with the insights you need to make better decisions tomorrow.
Conclusion: Business Analytics Software That Adapts to Your Workflow
In the end, the system is much simpler than it may have seemed at first.
Custom fields store the information that matters. Objects turn tasks into structured business processes. Directories keep recurring data consistent. Analytics capture actual operations. Reports show what is really happening.
With light bulbs, the example feels simple — and even a little amusing. But the same approach can be used to manage equipment purchases, projects, profit calculations, business travel, service requests, expenses, and many other workflows.
Planfix is more than a CRM. It is flexible business analytics software and a no-code CRM that can be adapted to the way your company actually works.
You can start small: one custom field, one object, one directory, and one report. Then gradually expand the system with data tags, automation, notifications, scripts, and additional processes.
The key is to understand the basic connection between these elements. Business data should not simply be stored — it should work for you. Once that happens, Planfix stops feeling like a collection of settings and becomes a clear business management system.
How to configure these elements and standardize them for your company’s specific needs is something we can explore in the second part.
FAQ
How does business analytics software help companies?
Business analytics software helps companies turn daily operational data into clear reports and practical insights. Instead of collecting information manually from chats, spreadsheets, and separate tools, teams can track tasks, costs, statuses, and performance in one system. This makes it easier to understand what is happening, find weak points, control expenses, and make faster management decisions.
What is operational analytics?
Operational analytics is the analysis of data collected during everyday business processes. It focuses on practical work: tasks completed, expenses recorded, materials used, time spent, requests processed, or services delivered. In Planfix, operational analytics can be collected directly inside workflows, so employees enter data once and the system uses it later in reports and process monitoring.
How does Planfix support CRM customization?
Planfix supports CRM customization through custom fields, objects, directories, data tags, reports, processes, and automation tools. Companies can configure their own data structure, create custom workflows, add business-specific fields, and build reports without changing the core system. This helps teams adapt Planfix to sales, service, projects, finance, internal operations, or other company-specific processes.
Can Planfix work as a no-code CRM?
Planfix can work as a no-code CRM because users can configure many business processes without writing code. Teams can create custom objects, add fields, build directories, set up analytics, and create reports through the interface. This allows companies to adapt the system to real workflows faster and avoid involving developers for every process change.
What is a custom reporting system?
A custom reporting system is a reporting setup that reflects the specific metrics and processes of a company. Instead of using only standard reports, teams can choose what data to display, how to group it, which filters to apply, and which indicators to calculate. In Planfix, custom reports can help track expenses, tasks, purchases, operations, projects, and other business data.