Manage Multi-Projects Efficiently
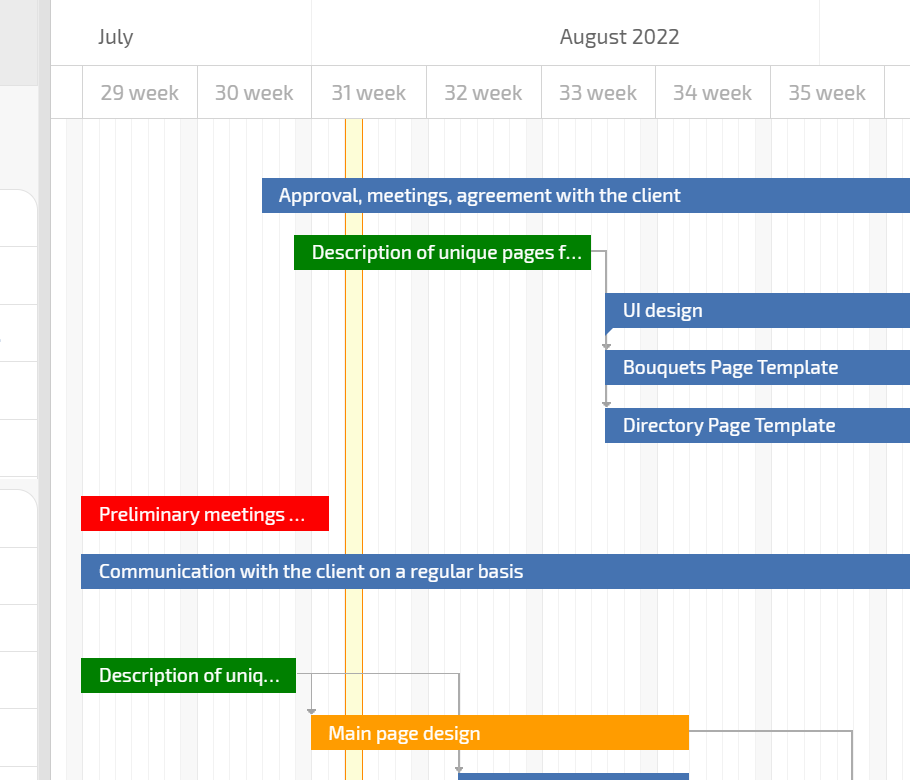
A Gantt chart is a tool that helps with the project-management cycle and monitoring overall team workload. Gantt charts help you make changes and adjustments in seconds.

A Gantt chart is a tool that helps with the project-management cycle and monitoring overall team workload. Gantt charts help you make changes and adjustments in seconds.

Grouping all projects in one interface makes work faster and more convenient. You can see how a project is progressing, who is actively working on it, and task dates and dependencies.

TEAM MANAGEMENT
Gantt charts help you get a feel for team workload. You can see which employees have too much going on and which employees have openings for new tasks so work on different projects can be distributed evenly.

Manage all projects in one interface and make changes to even the most complex workflows using colored flags and the drag and drop feature.

Gantt charts clearly show your projects' deadlines and their start and completion dates, as well as overdue projects, which helps take management to a new level.