- ▪︎ What Is the Traffic Light Method (Rag)?
- ▪︎ When Can the Traffic Light Method Be Used Effectively?
- ▪︎ Traffic Light for Task Monitoring
- ▪︎ Setting Up Custom Fields
- ▪︎ Configuring Automatic Scripts
- ▪︎ Tracking Changes in All Project Tasks
- ▪︎ Sending the Report via Email
- ▪︎ FAQs About Traffic Light (RAG) Method
Recently, we promised to explain how to set up report mailing with a traffic light system. This system allows tracking of whether team members are completing their tasks on time.
As a reminder, we provided an example of a worker named Mike who realized he wouldn’t finish a task on time and needed to push back the deadline by a few days. Additionally, Mike must remember to notify his supervisor, John, about this delay.
He could do this via personal messages. However, when Mike juggles multiple tasks, and John manages dozens of employees in the department, it becomes quite time-consuming to chat and sort out the reasons for delays in each task or project.
It’s particularly frustrating when the delay is minor and doesn’t affect the department Mike and John work in or the company.
But it’s also important not to neglect these situations. Otherwise, there’s a risk that employees will become too relaxed, leading to more frequent schedule disruptions and increasingly longer delays.
What Is the Traffic Light Method (Rag)?
The Traffic Light Method, also known as the RAG (Red, Amber, Green) status reporting, is a straightforward and visual technique used in project management to monitor and communicate the status of various project elements. By using color codes, project managers and stakeholders can instantly identify areas that are on track, need attention, or are in critical condition.
RAG Color Codes
Red (R)
- Meaning: Critical issues that require immediate attention.
- Example: A project task that is significantly behind schedule, over budget, or facing major obstacles.
- Action: Urgent intervention and problem-solving are needed to get back on track.
Amber (A)
- Meaning: Warning signs or potential issues that could escalate if not addressed.
- Example: A project task that is slightly behind schedule or slightly over budget, but still manageable.
- Action: Monitoring and preemptive measures to prevent escalation into a red status.
Green (G)
- Meaning: Everything is on track and progressing as planned.
- Example: A project task that is on schedule, within budget, and meeting quality standards.
- Action: Continue with the current course of action, maintaining regular checks to ensure it stays on track.
When Can the Traffic Light Method Be Used Effectively?
The Traffic Light Method (RAG) can be used effectively in various scenarios within project management and beyond. Its simplicity and visual nature make it a versatile tool for different stages of projects and diverse types of work environments. Here are some key situations where the Traffic Light Method can be particularly effective:
- Progress Tracking: RAG status can be applied to individual tasks, milestones, or overall project health.
- Status Reporting: Regularly updating the RAG status in project management helps keep the project team and stakeholders informed about progress and potential risks.
- Decision Making: Helps prioritise resources and efforts towards areas that need the most attention.
- Communication: Provides a clear and visual way to convey project status during meetings and reports.
Benefits of the Traffic Light Method
- Simplicity: Easy to understand and implement.
- Visual Clarity: Provides a quick overview of project health.
- Focus: Helps teams focus on critical issues and areas that need improvement.
- Accountability: Encourages accountability by clearly highlighting areas that require action.
Traffic Light for Task Monitoring
To help a supervisor save time and distinguish tasks that are on schedule from those that have become problematic, we’ll set up a traffic light system for project management and task monitoring. This setup requires three additional custom fields and an automated script.
In the end, you’ll be able to periodically send an email report to a manager or client that looks like this:
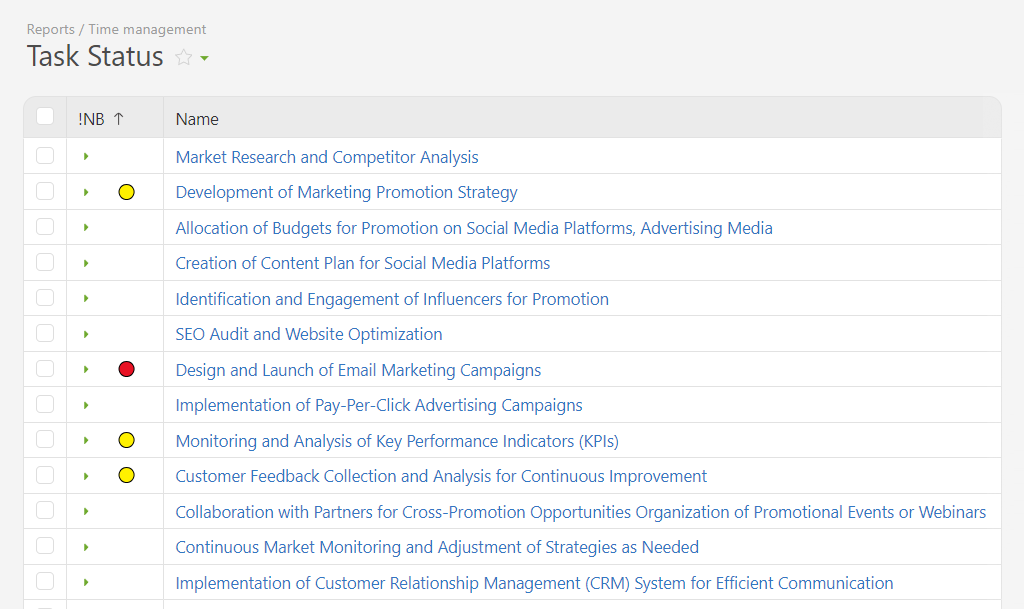
From this, you can immediately see which tasks require the supervisor’s urgent attention and which are just slightly behind schedule.
Setting Up Custom Fields
“Estimated Date” Field
Let’s begin by creating a custom field type, “Date.”
We’ll name it “Estimated Date.” In this field, the assignee will specify the estimated date of task completion:
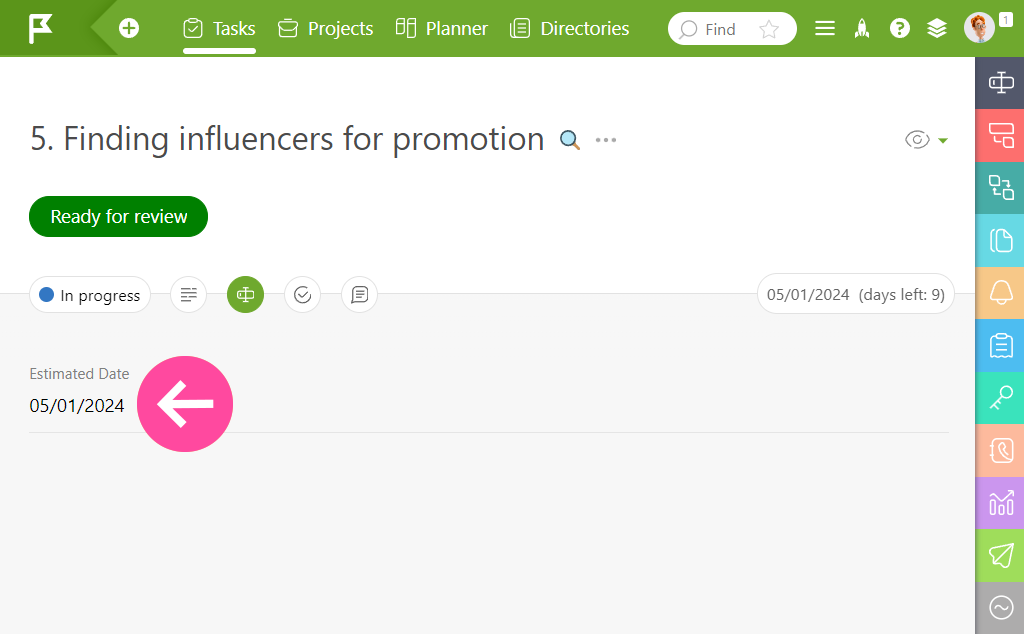
If, during the process, the assignee realizes the task will be finished after the planned due date, they should update the estimated date. The difference between the scheduled due date and the new estimated date will form the basis of our traffic light system.
“Task Condition” Field
This will be a “list” type field responsible for color-marking the tasks in the report – our traffic light. We’ll call it “Task Condition.”
- Red – the task won’t be completed on time, with a delay of more than 3 days.
- Yellow – the task won’t be completed on time, with a delay of up to 3 days.
If the task is completed on time, we don’t mark it because everything is proceeding as planned. To get the desired color markings in the report, insert colored circle emojis into the “list” type field:
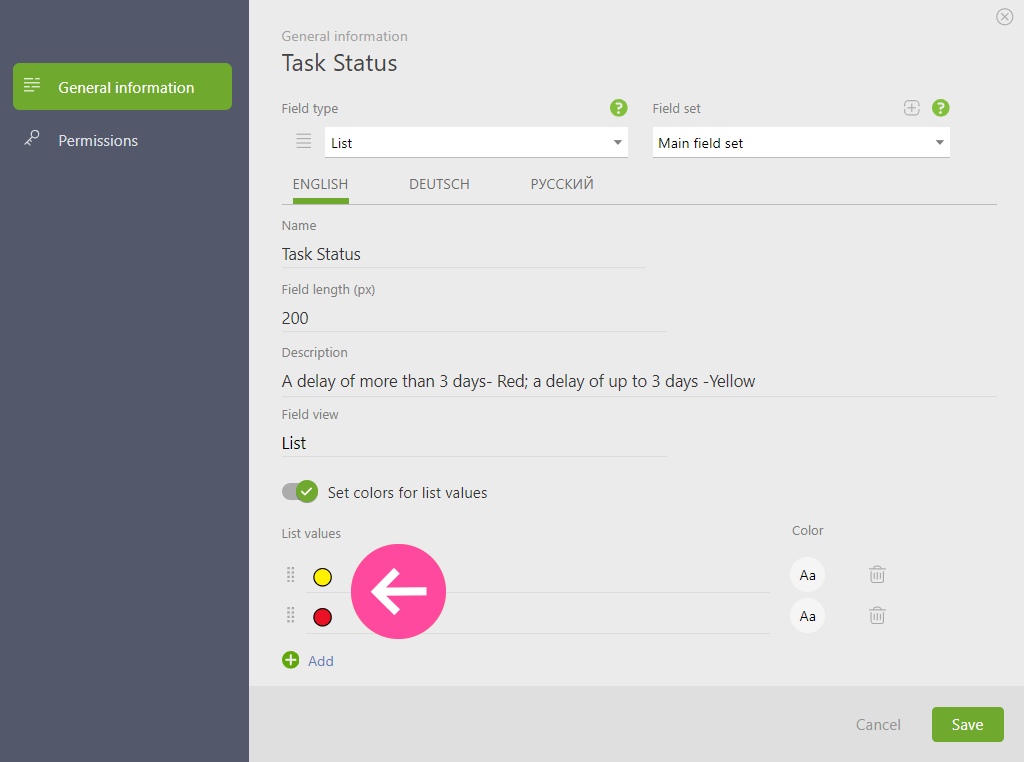
You can find these emojis online by searching for “yellow/red circle emoji” and copying them into Planfix.
Overall, labels can vary. For instance:
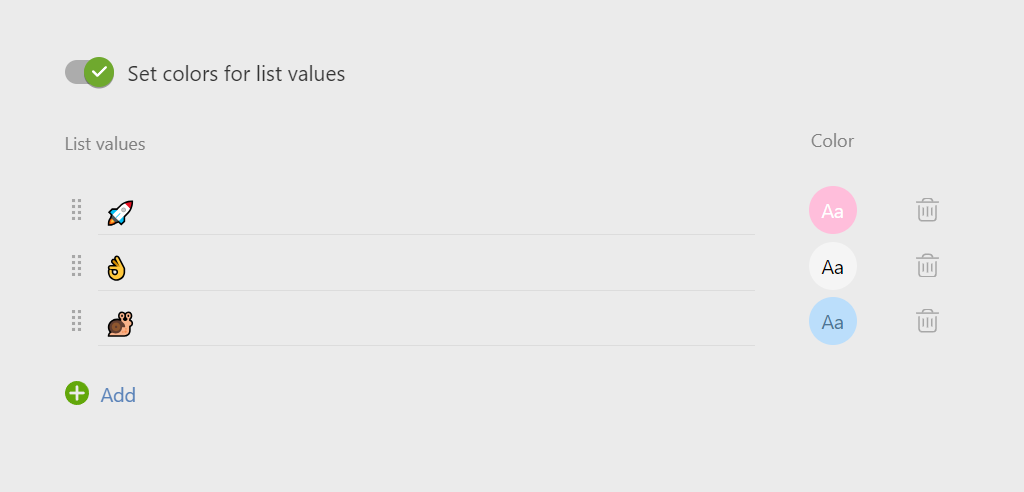
“Deviation” Field
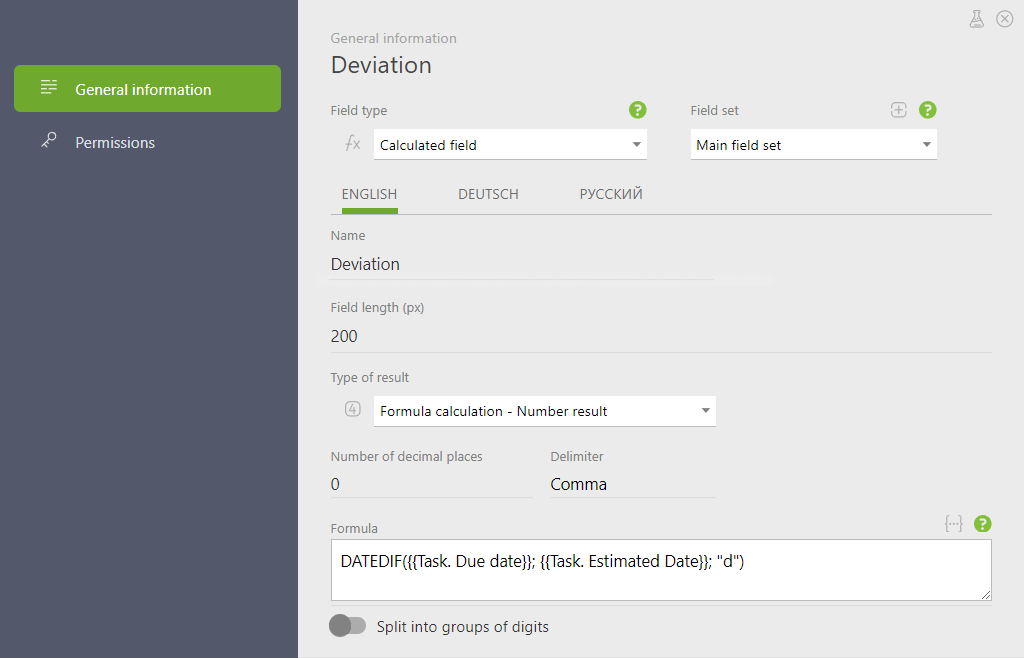
As soon as the assignee realizes he will not meet the set due date for a task, he adjusts the estimated date. This adjustment involves the third custom field — a calculated field.
We name this field “Deviation” and include the DATEDIF() function in it. This function is essential for Planfix to calculate the difference between the forecast completion date and the originally scheduled date. The field settings will look like this:
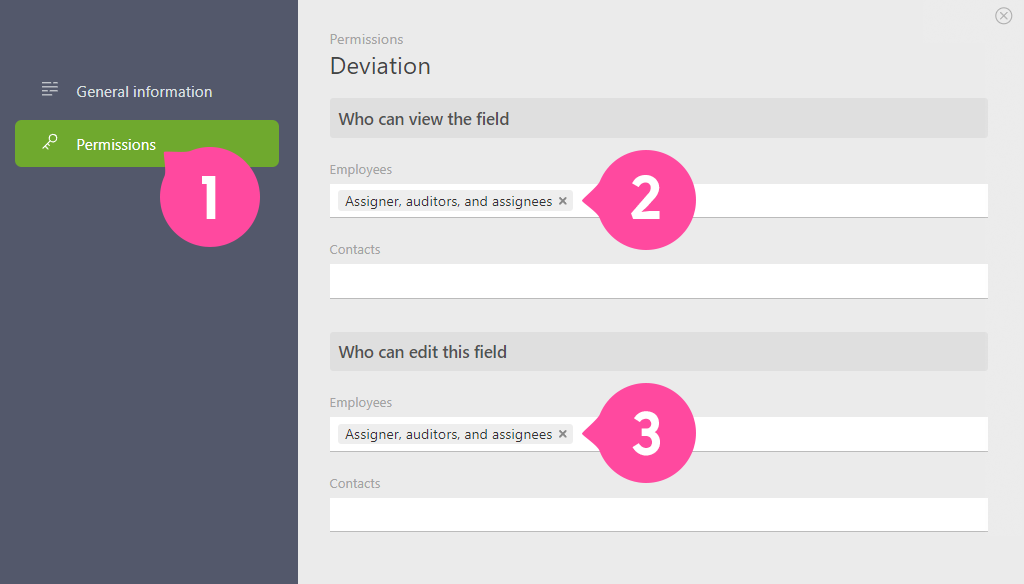
After completing the field settings, there is one more important aspect to consider: to ensure that an employee doesn’t accidentally or intentionally change the task label, it’s advisable to hide the “Task Condition” and “Deviation” fields from their view:
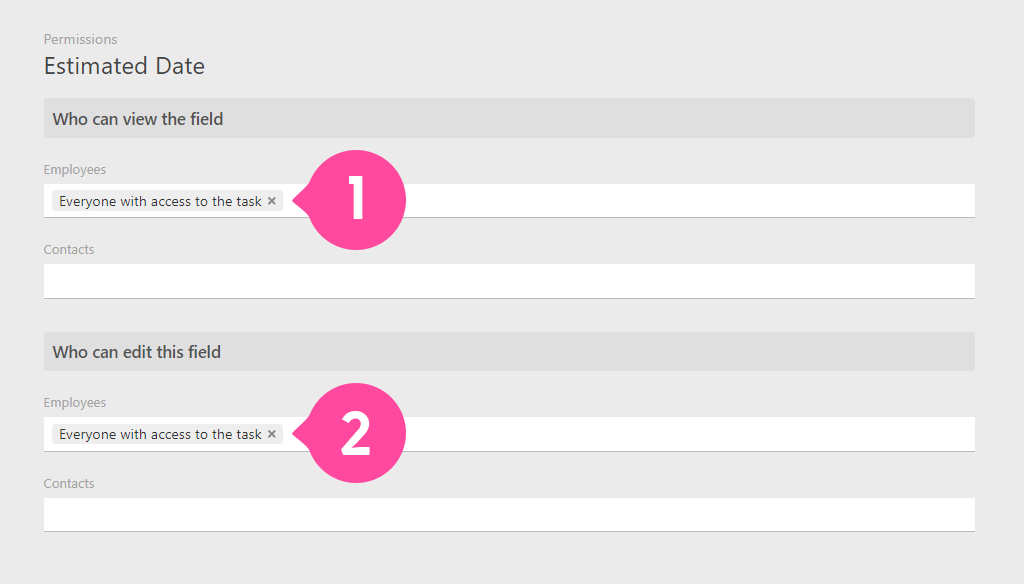
At the same time, it’s crucial to give the assignees access to the “Estimated Date” field for viewing and editing. Without this access, they won’t be able to adjust it if necessary:
Configuring Automatic Scripts
With the required custom fields in place, we can now set up automatic scripts that monitor task deadlines and apply the appropriate labels.
Since we need to monitor two periods of task delays (up to 3 days, and more than 3 days), we will set up two automatic scripts.
The first is the script for delays of up to 3 days:
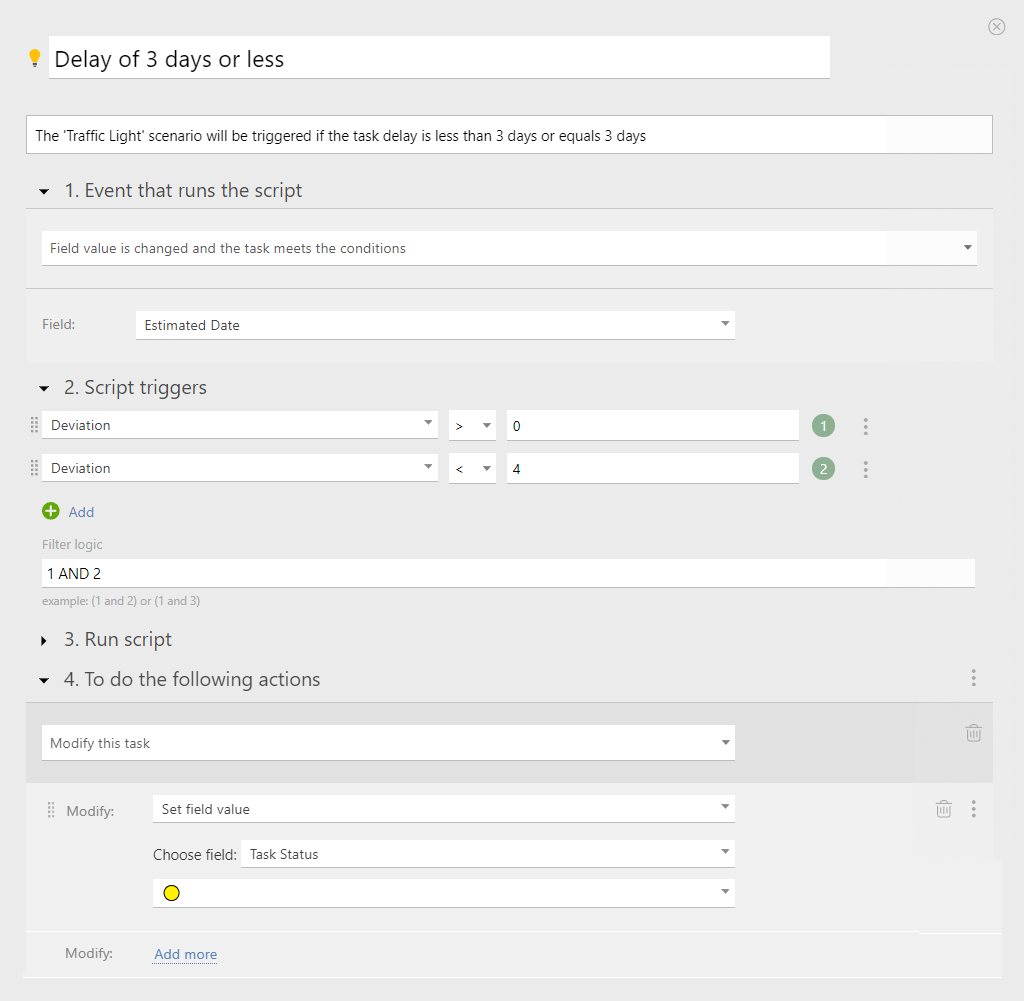
If the estimated task date is adjusted and the difference between the planned and estimated dates is up to 3 days, a yellow circle is automatically added to the “Task Condition” field.
Similarly, we configure a script for instances when the delay exceeds 3 days:
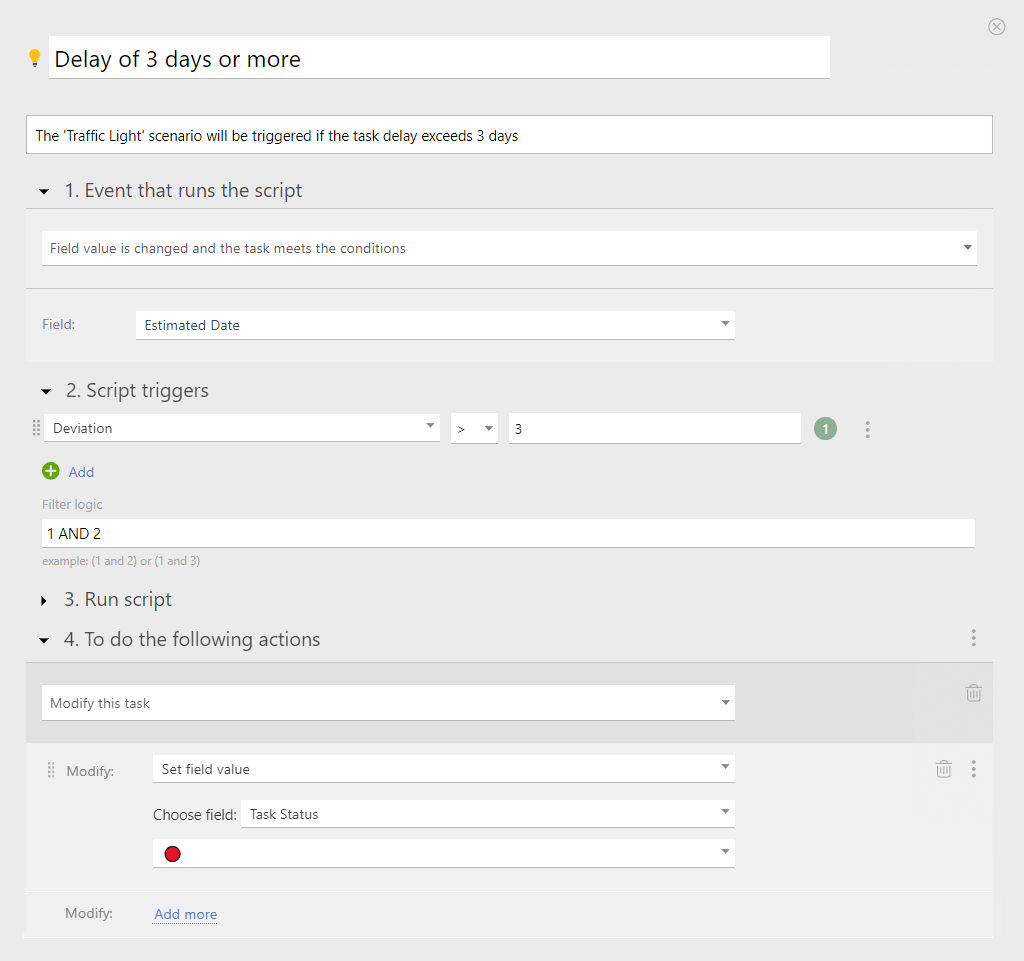
Overall, it works as follows:
- The assignee sets the estimated completion date.
- The automatic script calculates the difference in days and immediately assigns the appropriate label to the task. This label is then visible to the manager in the report.
Tracking Changes in All Project Tasks
Everything is now in place for the final step – setting up the report and scheduling it for delivery to the manager or client.
Setting Up the Report
Here, we will need three columns:
- Task condition – Displays the traffic light label.
- Title – Shows the task name.
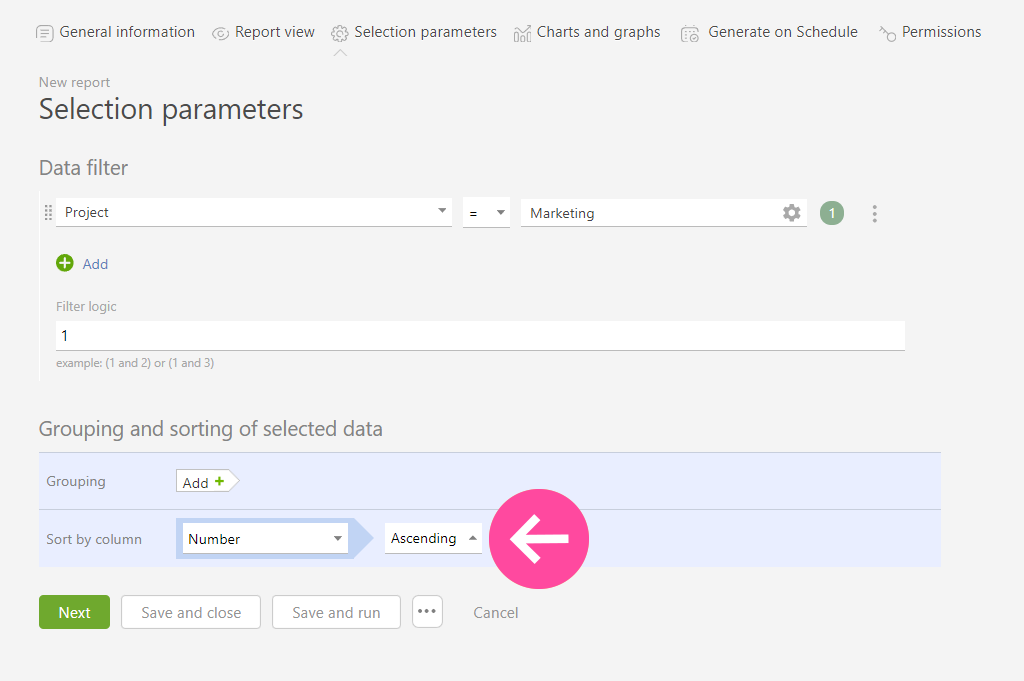
- Number – Used for sorting tasks in order:
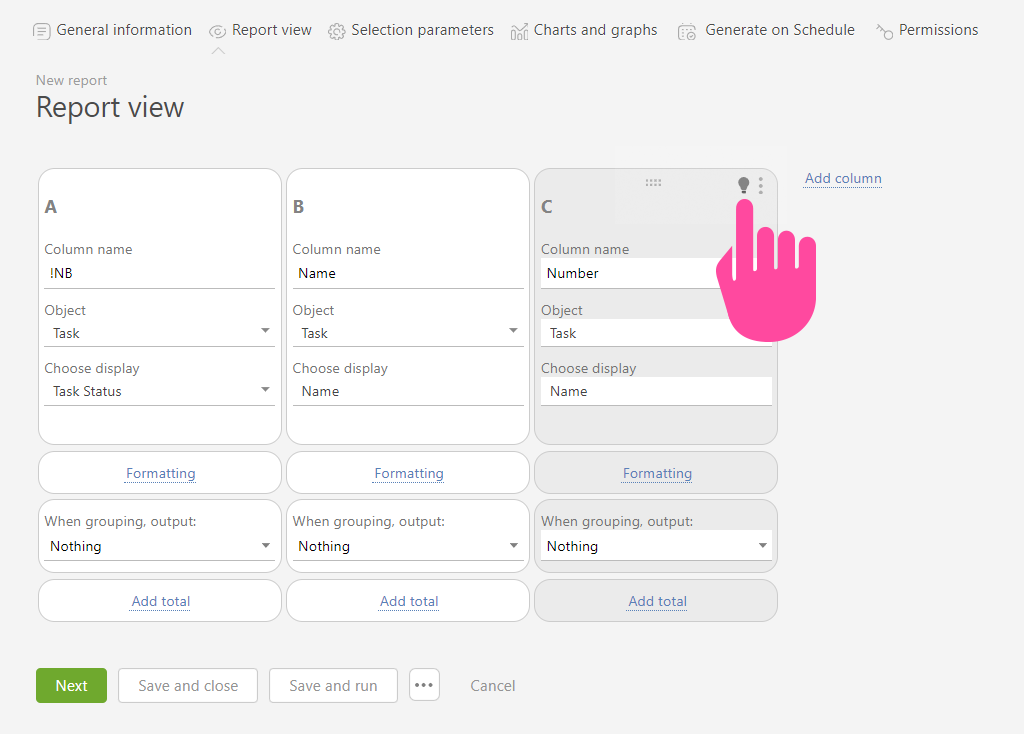
Note that the light bulb icon next to the task number column is “off” – this means the data from this column will not be displayed in the report. We use this column solely for sorting tasks:
Save and run the report. As a result, you’ll get a list of tasks with labels indicating deviations from task timelines:

Sending the Report via Email
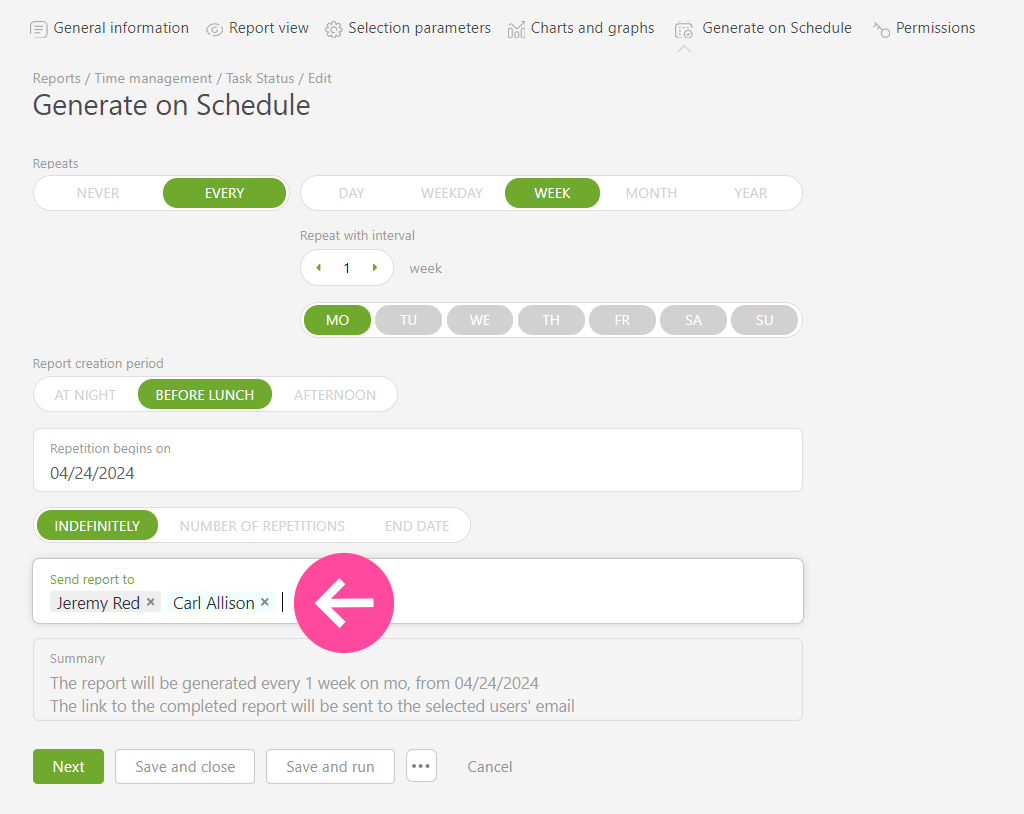
And now comes the exciting part. To avoid manually running the task tracking report every time you need it, you can set up scheduled email delivery of the report. Planfix will send it to selected employees or clients on a specific day:
Conclusion
Ultimately, you gain an effective tool for tracking task deviations from the planned work schedule within a project. And this is just one application of such a mechanism. In reality, there are many more possible uses.
For instance, using colored markers and creating reports, you can categorize agreements by revenue amount and much more. Essentially, as always, everything depends on your creativity.
If you set up such a traffic light system for project management, share your examples with us. We would be delighted to read about them. As always, we will feature the most original examples on our blog.
P.S.
There is still room for improvement and optimization In the described scenario. For example, a problem could arise if you are trying to ensure that employees consistently update their estimated dates every Friday, given that the supervisor receives a project report every Monday.
So far, I see two possible solutions to this:
- Use a recurring task: employees will receive the report every Friday and set their estimated dates.
- Use a recurring reminder: create a single task with the given reminders. This solution is appealing as it doesn’t create new tasks.
If you have alternative solutions to this challenge, please share your thoughts in the comments. Your insights would be valuable and interesting to consider.
FAQs About Traffic Light (RAG) Method
What is a traffic light in project management?
In RAG project management, a traffic light system is a visual tool used to indicate the status of a project.
Red signifies serious issues that need immediate attention, Amber (Yellow) denotes potential problems or minor delays, and Green indicates that everything is on track. This method helps teams quickly assess and communicate project health and progress.
What is the rag status on a project?
The RAG status on a project is a visual reporting tool that uses Red, Amber (Yellow), and Green indicators to show the current state of the project.
Green means the project is on track, Amber indicates potential issues or minor delays, and Red signifies serious problems that require immediate attention. This system helps stakeholders quickly understand the project’s health and progress.
What are the advantages of rag reporting?
RAG reporting offers several advantages for project management.
The visual clarity of the project status overview. Early warning about potential issues (Amber) and critical problems (Red). It improves communication and transparency of collaboration.
