
- How RFM Analysis Can Help Your Business
- Key Criteria for Identifying High-Value Customers with RFM Analysis
- Setting a Rating Scale
- How Many Customer Segments Should You Use?
- Strategies for Engaging Different Customer Segments
- Where to Use RFM Analysis Results
- How to Conduct RFM Analysis
- Tags or Indexes? Choosing the Right Approach
- Automating RFM Segmentation in Planfix
- Filtering Customers by Segments
If you want to run a successful business, segmenting your customer base is one of the most powerful tools at your disposal. I mean, wouldn’t it be great if you could know exactly which customers are your biggest fans, which ones are still deciding, and which are just here for the giveaways?
That’s where RFM analysis comes in. With this helpful strategy, you can get data-driven, strategic insights into your brand’s customer loyalty.
How RFM Analysis Can Help Your Business
RFM analysis offers businesses an incredibly effective way to segment their customers based on three key behaviors: how long it’s been since their last purchase, how often they buy, and how much they spend.
By analyzing these three factors, companies can categorize customers into different groups, from high-value VIPs to customers who need a little nudge to return. This has major implications for a company’s marketing efforts. Rather than taking a one-size-fits-all approach, RFM allows you to tailor your marketing strategies to each group, allowing you to maximize both engagement and revenue.
A broader look at segmentation strategies and their benefits can be found in Customer Base Segmentation: Boosting Sales and Strengthening Loyalty.
Key Criteria for Identifying High-Value Customers with RFM Analysis
Not all customers are the same, and not all buying habits mean the same thing. For instance, a customer who spends a lot of money once is not necessarily more valuable than a customer who frequently spends little money. Understanding this is a big reason why companies should divide their audience into clear segments.
How Recently a Customer Purchased
The Recency category indicates how active a customer is at the moment. The more recently a customer has interacted with a brand, the more engaged they are.
How Often a Customer Buys
Frequency is another category for measuring customer loyalty. Customers who purchase regularly are more loyal than those who buy once in a blue moon.
How Much a Customer Spends
The Monetary category is used to determine a customer’s overall value. After all, not every purchase has the same weight. In fact, some customers spend more on a single visit than others spend on multiple transactions.
There are two main ways to evaluate a customer’s Monetary value:
- Total Spend – This tracks the lifetime value of a customer.
- Average Purchase Value – This measures how much they typically spend per visit.
There is a lot of value in being able to identify a customer’s spending habits early on. In a lot of cases, those with consistently high order values may be more likely to purchase premium products in the future.
Setting a Rating Scale
In RFM segmentation, companies normally use a three to five-level rating scale for each metric:

In this case, each parameter is assigned a numeric or letter-based rating, and the tier size can be easily customized according to the company’s needs.
Here are some examples of ratings and some explanations of who they might need to be adjusted based on the company type:
- Monetary (spend level) – A $10,000 purchase may be a large order for a toy store, but this would be a relatively small transaction for a luxury furniture store.
- Recency (time of last purchase) – If a customer last visited a car repair shop three months ago, they may still be considered “recent.” However, for a gym membership, three months of inactivity is a big red flag.
- Frequency (regularity of purchase) – If someone buys a new cell phone once a year, an electronics store would probably count them as frequent. However, if someone only buys clothes once a year, a fashion brand might consider them an inactive buyer.
How Many Customer Segments Should You Use?
Once customers are rated in each category, they are assigned an RFM score. This is what allows them to be placed in a specific segment.
For example:
- “111” rating indicates a low-value customer who hasn’t bought in a long time, buys infrequently, and spends little when they do buy.
- “333” rating – This indicates a “golden” customer who buys regularly, purchased recently, and spends a lot of money when they buy.
With a three-level scale per metric, companies can create 27 possible customer segments.
However, you can easily increase the number of levels if you need more precise segmentation. In many cases, grouping the segments into larger clusters is a more practical way to facilitate marketing strategies.
Strategies for Engaging Different Customer Segments
Once you have segmented your audience using RFM analysis, it’s time to put the data to use. Different customers need different marketing approaches, and the beauty of RFM modeling is that you can use it to personalize your engagement strategy for each project.
Here are a couple of examples.
| 111 | Occasional Shoppers Investing too much effort in this group isn’t cost-effective, but a well-timed discount code could lure them back. |
| 313 | High-Spending Newcomers These customers have made a big first purchase, which is obviously great news! But will they come back, or was it a one-off? A follow-up email with exclusive “new customer” benefits might be able to seal the deal. |
| 321, 221, 311, 211 | Budget-Conscious & Infrequent Buyers These shoppers are like friends who only show up when there’s free food. They love a bargain, so make sure they know about every sale and discount. |
| 223, 323 | Occasional Big Spenders These customers are not impressed by standard discounts. They aren’t price-sensitive. Instead, they like exclusive experiences and the feeling of being VIPs. That’s why it’s best to offer them early access to new products, personalized recommendations, or invitations to exclusive sales events. |
| 333 | The “Golden” Customer These are your ride-or-die customers. They buy often, spend a lot, and keep coming back. Keep them happy with exclusive offers, gifts, and premium loyalty rewards. You might even consider assigning them a dedicated account manager to personalize their shopping experience. |
| 133 | Former “Golden” Customers These customers were once some of your best, but they’ve since disappeared. Therefore, winning them back should be a top priority! If you can, try to find out why they left. For instance, you might consider sending them a personalized “What went wrong?” email. |

Where to Use RFM Analysis Results
Targeted Email Campaigns
Here’s where things get really strategic, because you can craft personalized marketing emails for each customer segment to ensure the messages resonate with their behavior. In fact, with Planfix filters, you can easily export customer lists and automate email marketing effortlessly.

Retargeting Ads
To encourage repeat purchases, you might consider placing targeted advertising on social media.
In this case, Planfix can export the customer data as CSV files, which can then be uploaded to platforms like Facebook and Google Ads. This way, you can make sure you’re only serving ads to people who already know your brand, avoiding unnecessary ad spend. Best of all, the ads can be easily tailored to the relevant segment. For example, you might implement:
- Exclusive offers for VIP customers
- Win-back campaigns for former customers
- Product recommendations based on purchase history
Instead of randomly placing ads, you’re only targeting those who are most likely to convert. It’s not only smart, it’s cost-effective.
Automated Notifications
RFM segmentation can also automate customer interactions, allowing you to target them with minimal manual effort. For example, you could set it so that customers automatically receive an invitation to join a VIP program when they reach a certain spending threshold. Similarly, when a customer starts to become inactive, they automatically receive a “We miss you” promo code.
You can also customize things like birthday and holiday messages based on spending habits and engagement.
How to Conduct RFM Analysis
RFM segmentation can be done manually in Excel or automated using a CRM system like Planfix. While Excel may seem convenient, it does have some drawbacks that can make the process inefficient in the long run. For example…
- Complex setup – Setting up RFM formulas in Excel requires some pretty advanced spreadsheet skills, and a single mistake can ruin your entire analysis.
- Frequent updates – Since customer behavior constantly changes, you’ll need to manually update your RFM data by exporting the latest records from your CRM. This means you’ll need to set up multiple calendar reminders, which can quickly become tedious.
- Time-consuming process – RFM modeling is often used for marketing campaigns, customer notifications, and sales strategies. If you manage this manually in Excel, you’ll likely have to re-import the segmented data into your CRM whenever an update is required.
A better solution? Use Planfix. This innovative solution allows you to easily automate RFM segmentation using built-in filters and workflows.
If a customer’s behavior changes (for example, if they start to shop more frequently or spend more), the system automatically assigns them to the appropriate segment. This ensures that your segmentation stays up to date without constant manual RFM analysis. You also don’t have to worry about outdated customer data.
Tags or Indexes? Choosing the Right Approach
As we’ve already shown, traditional RFM segmentation assigns customers numeric indexes (e.g., “232” or “113”). However, Planfix offers a more flexible approach using tags.

Planfix’s tag-based system not only simplifies customer segmentation, it makes it infinitely more flexible. This is because tags allow you to easily set up advanced filters that combine multiple audience segments for precise targeting.
For example, tags make it much easier to retarget customers who used to buy frequently but have recently become inactive. And unlike numerical indexes, tags make segmentation more intuitive – you don’t have to decode what “232” or “113” means.
To set up tags in Planfix, simply use a “List” field.

Automating RFM Segmentation in Planfix
As previously mentioned, scripts control automatic segmentation in Planfix. These scripts capture each customer’s frequency, recency, and monetary value and automatically assign them the appropriate tags.
Of course, the exact setup can vary depending on your business’s needs. You can find a helpful example below. However, if you need further customization or a tailored approach, you can always contact one of Planfix’s certified integration partners for expert assistance.
Recency
Let’s create a “Date and time” field to record when a customer last made a purchase. This field is updated whenever a deal is moved to the “Completed” status (or any other relevant status).

To ensure that this field is updated automatically, we’ll configure a script in the “Deal” object.

Now, we’ll set up scripts to tag customers with time-based tags. Now, whenever a deal is recently closed, the Last purchase date field is automatically updated, and the system re-evaluates the customer’s segment.

For tags such as “A while ago” or “A long time ago,” we use a time-based trigger that applies the tag after a certain period of inactivity (e.g., 31 days since the last purchase).

Average Order Value
For Average Order Value, we can create a “Total Order Amount” field in the Deal object to track how much a customer typically spends.
The manager has two options. You can either manually enter the order amount or let Planfix’s data tag tool do the work. Data tags are a built-in feature that automatically tracks and aggregates data, ensuring that order values remain accurate without the need for manual updates.

Next, let’s add three numeric fields to the contact template. They are:
- The total sum of all orders
- Number of orders
- Average order value
We will then configure a script to update these fields automatically.
The first script is linked to the “Deal” object. It will automatically add the amount of a new order to the total purchase sum accumulated in the client’s card.

This way, when the formula is calculated, values from the specified fields will automatically replace the variables.
The second script is linked to the contact process. It tracks the number of orders placed by the client.

The third script, also in the Contact process, calculates the “Average Order Value”.

As a final touch, we can assign tags to the client’s card based on their average order value.
For example, if the client’s average order exceeds $500…

…we label their average check as “High”.

Tracking Purchase Frequency
To calculate how often a customer buys, we use the Number of Orders field together with four other fields. They are:
● Contact Creation Date (date and time)
● Interaction Tracking Date (date and time)
● Time Since Contact Creation (number)
● Purchase Frequency (calculated field)
Recording Contact Creation Date
This field is essential for determining how long a given customer has been active.

Measuring Customer Relationship Length
We use the “Contact Creation Date” field alongside the DATEDIF function. To measure the number of full months since the contact was created, we use “m” as an argument in the formula.

In this case, the calculation can be triggered when you update the total sum of all orders or when a deal is marked as completed.

Alternatively, we can set up a recurring calculation of the relationship duration. In this case, the system automatically fills in the “Interaction Tracking Date” field when a customer profile is created.

We can then configure a monthly recalculation cycle.

This script not only updates the tracking date but also recalculates the length of the customer relationship.

Determining Purchase Frequency
The “Purchase Frequency” field is calculated by dividing the total customer orders by the total number of months since the relationship began.
However, this approach can lead to a minor hiccup. For example, if less than a month has passed since the contact was made, we would have to divide by zero, which we all know is impossible (unless we’ve suddenly cracked the laws of math).
To avoid this, we use an IF function in the formula. This way, “if” the number of months is zero, the frequency is set to the total number of orders.

Automating Frequency Adjustments
We can set up an automatic recalculation based on a specific time interval. This helps ensure that the purchase frequency gradually decreases when a customer has not bought anything for some time.
This works well if the customer relationship is also tracked regularly.
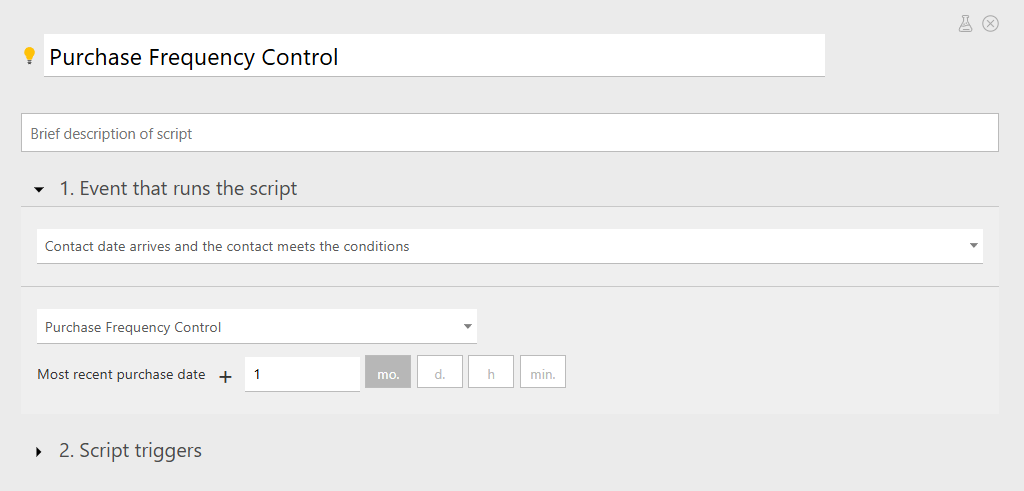
To automate this, we need an extra “Date” or “Date & Time” field called “Purchase Frequency Control”.
The first script is triggered one month after the customer’s last purchase.

It performs two critical actions:
● First, it recalculates the “Purchase Frequency” field.
● Next, it updates the “Purchase Frequency Control” field with the current date and time to be tracked.

Create a Recurring Cycle
The second script ensures continuous tracking of purchase frequency. It is triggered one month after the last update of the “Purchase Frequency Control” field.
It repeats the same two actions:
● It recalculates the purchase frequency.
● It updates the date of the “Purchase Frequency Control” date.

If a customer doesn’t buy anything for another month, the script runs again and updates the frequency and the control date.
Of course, the one-month period is just an example – you can easily adjust it as needed. The same applies to setting custom tags based on the period of inactivity.

Filtering Customers by Segments
It’s not enough to just tag customers – you need to segment your customer base properly using filters.
Planfix’s customer filters allow you to easily group customers based on specific conditions.
For example, we can set up a filter to identify “Golden Customers”.

Remember, filters don’t have to be based solely on tags. You can also combine conditions with other customer profile fields.
For example, to identify potential new customers, we can set these conditions:
- Recent Purchase
- High Order Value
- 1-3 Total Orders

You can also create a detailed and flexible segmentation system by combining filters and conditions.

Ultimately, RFM analysis helps marketers better understand their customers and run more precise advertising campaigns. However, it can be cumbersome and time-consuming when companies attempt to do everything “the old-fashioned way.”
With Planfix’s automation tools, you can save yourself countless hours of manual work while ensuring you always have up-to-date customer segmentation. Let Planfix handle the hard stuff while you (and your company) reap the rewards!