
Gantt charts are useful within Planfix because they store all the system’s links between tasks. This means that when tasks are moved or their deadlines are changed on a Planfix Gantt chart, all related tasks are also adjusted.
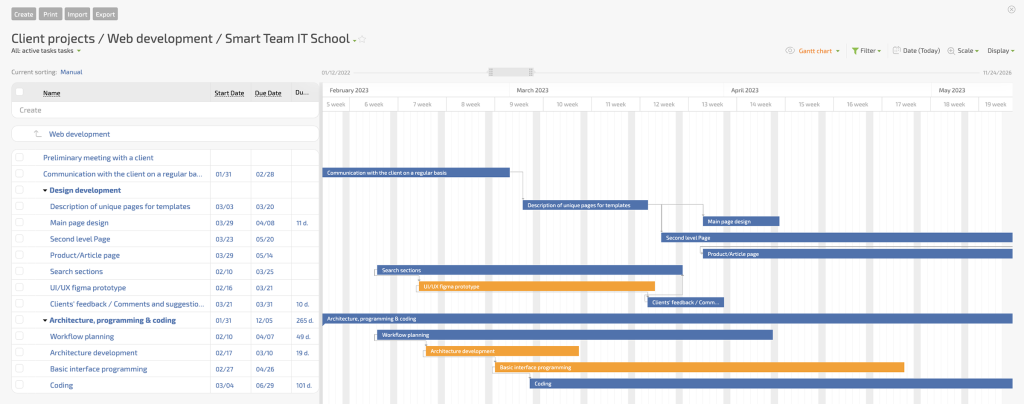
Admittedly, we didn’t even consider that someone might need to download a Gantt chart as an Excel file. As is often the case, our users helped us see the situation with fresh eyes.
Why Would I Need a Gantt Chart in Excel if I Have it in Planfix?
- You may want to share the chart with a customer who’s not connected to your Planfix account.
- You may also want to print out the chart, which you can’t currently do from Planfix.
How Do I Create a Gantt Chart in Excel Using Planfix Data?
Here’s a simple two-step process. It looks a bit long, but that’s just because we tried to describe the settings as clearly and with as much detail as possible.
Step One:
Creating a Report for Exporting Data from Planfix to Excel
Create a new report based on tasks:
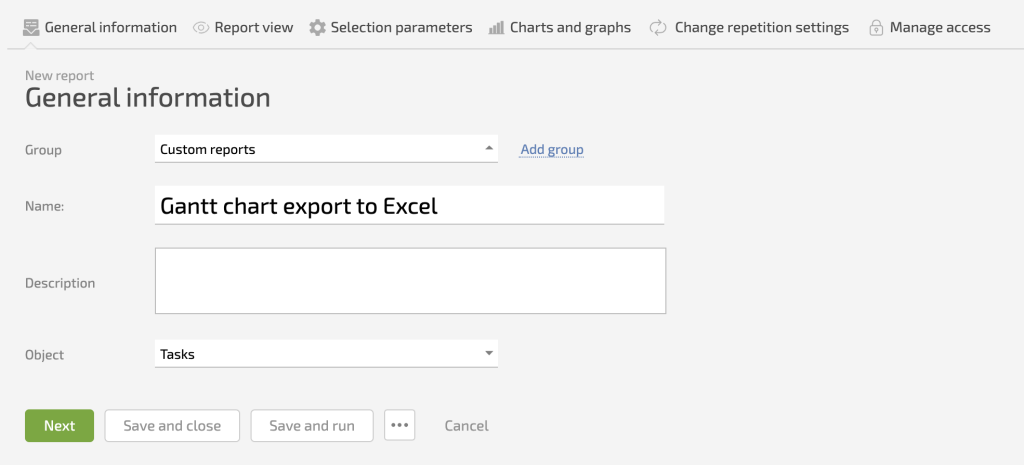
Add the columns to it that you’ll need for your Gantt chart:
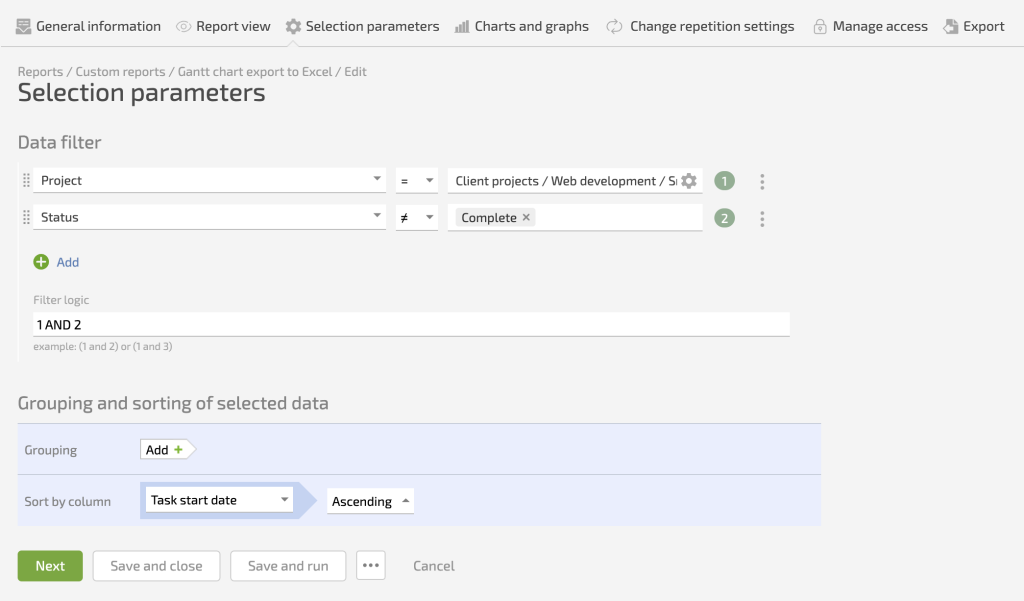
Set selection parameters and sort by “Start date”:

Save and run the report. What we get is a compact table with our results:
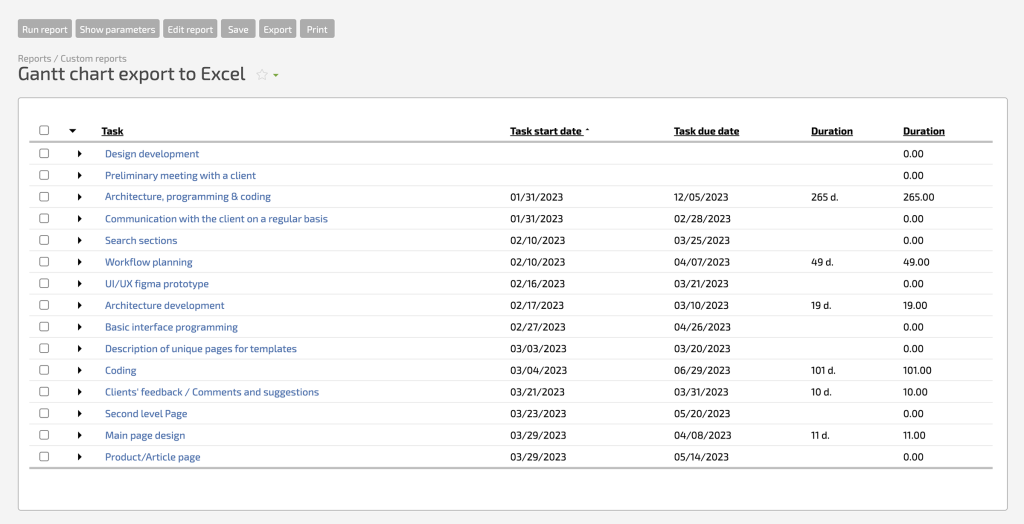
Export it to Excel:
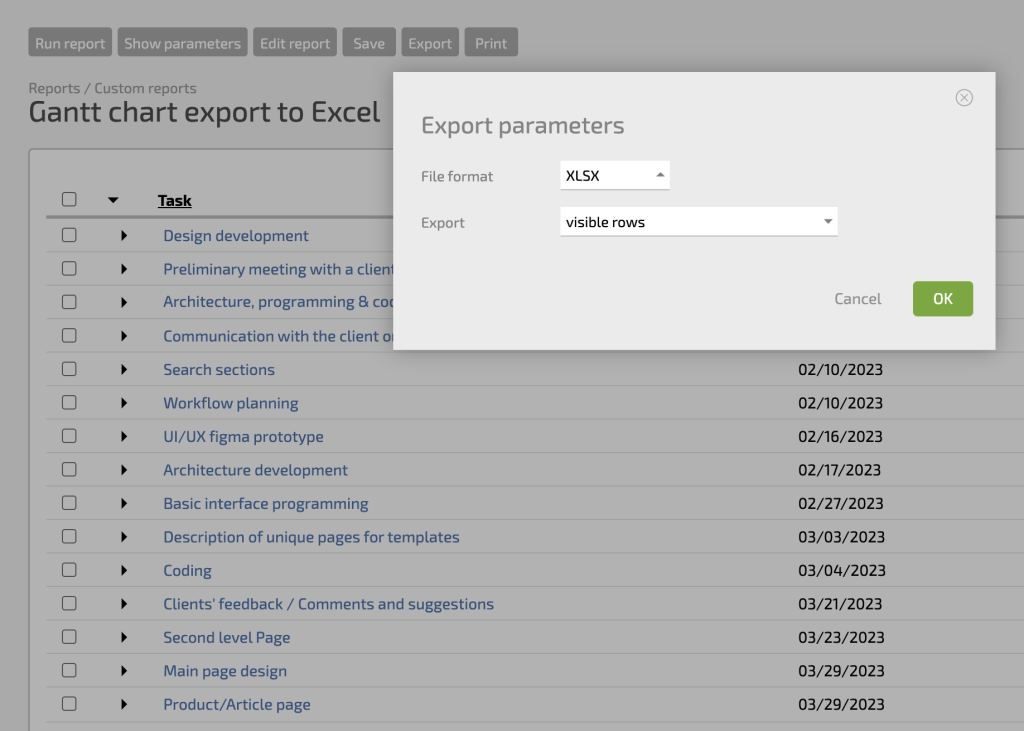
That’s the end of the first step. You now have the data you need in Excel to build the Gantt chart, and all you have to do is create it.
Step Two:
Creating the Gantt Chart in Excel
To create the chart, you’ll need to download the Gantt chart template in Excel.
What follows is a simple copy and paste:
- Open the template in Excel;
- Open the file with our exported report;
- Select the table from our file, and copy and paste it in place of the table in the template;
- This gives you the same Gantt chart but in Excel.
As you can see, this is quite easy to do. You’ll also appreciate that reports in Planfix only need to be set up once, and in the future, running the report, exporting it, and pasting the results in the Gantt template will take all of one minute.

