Reports: Report view
At this step, you configure how the report looks, meaning you configure the table where the data is displayed. You add columns to this table, which will be populated with data.
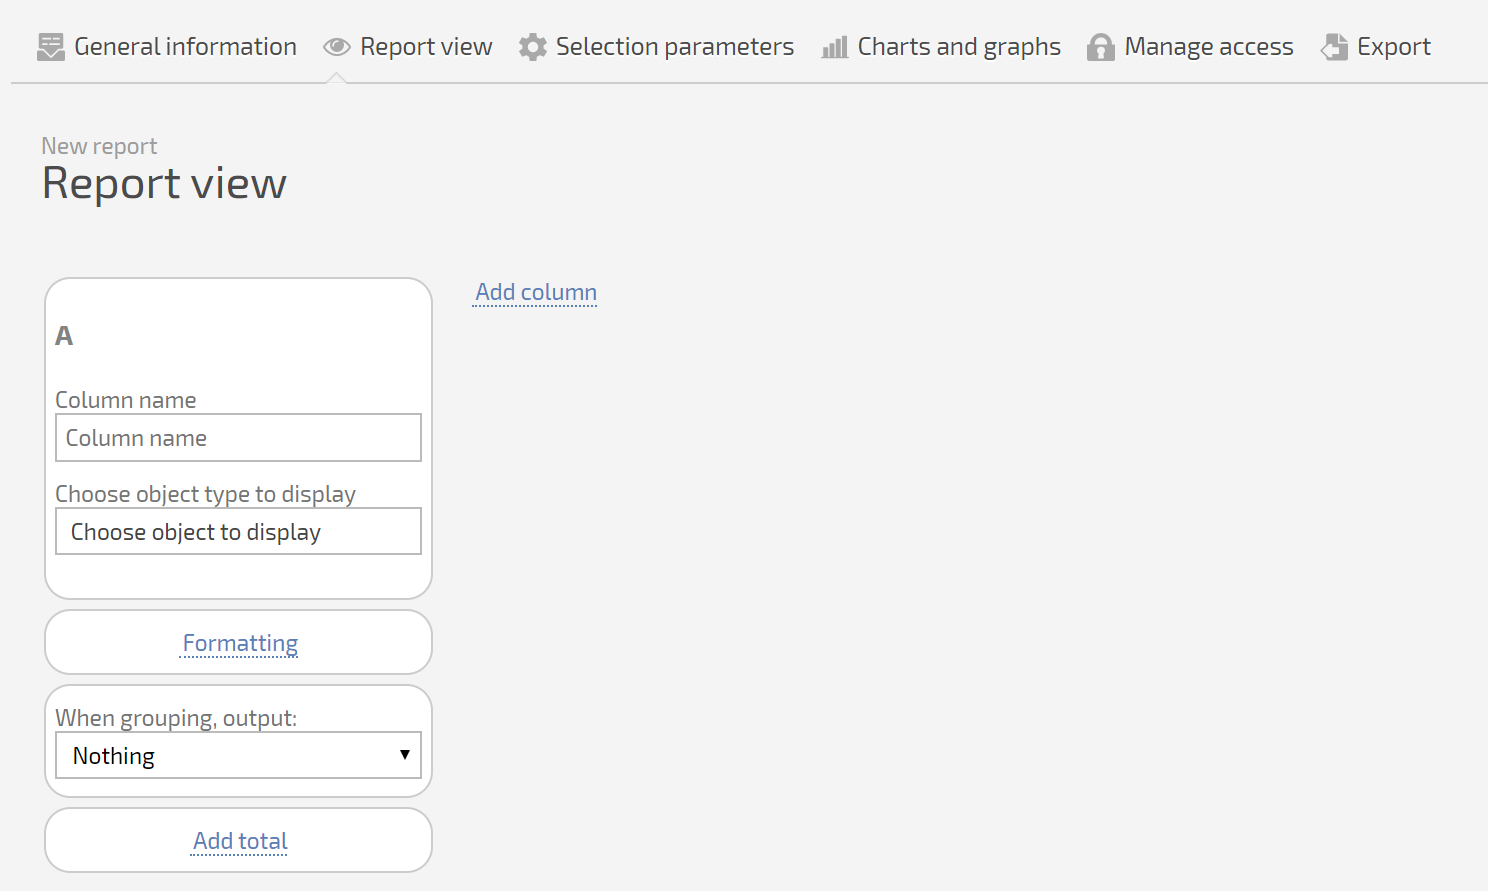
For each column, you must set at least:
- A column header.
- An object type for the output.
Depending on the type of object you choose, you may need additional details: Planfix will present the fields available for the object you selected, and you need to select the ones you need. Example of fields available for a Task object:
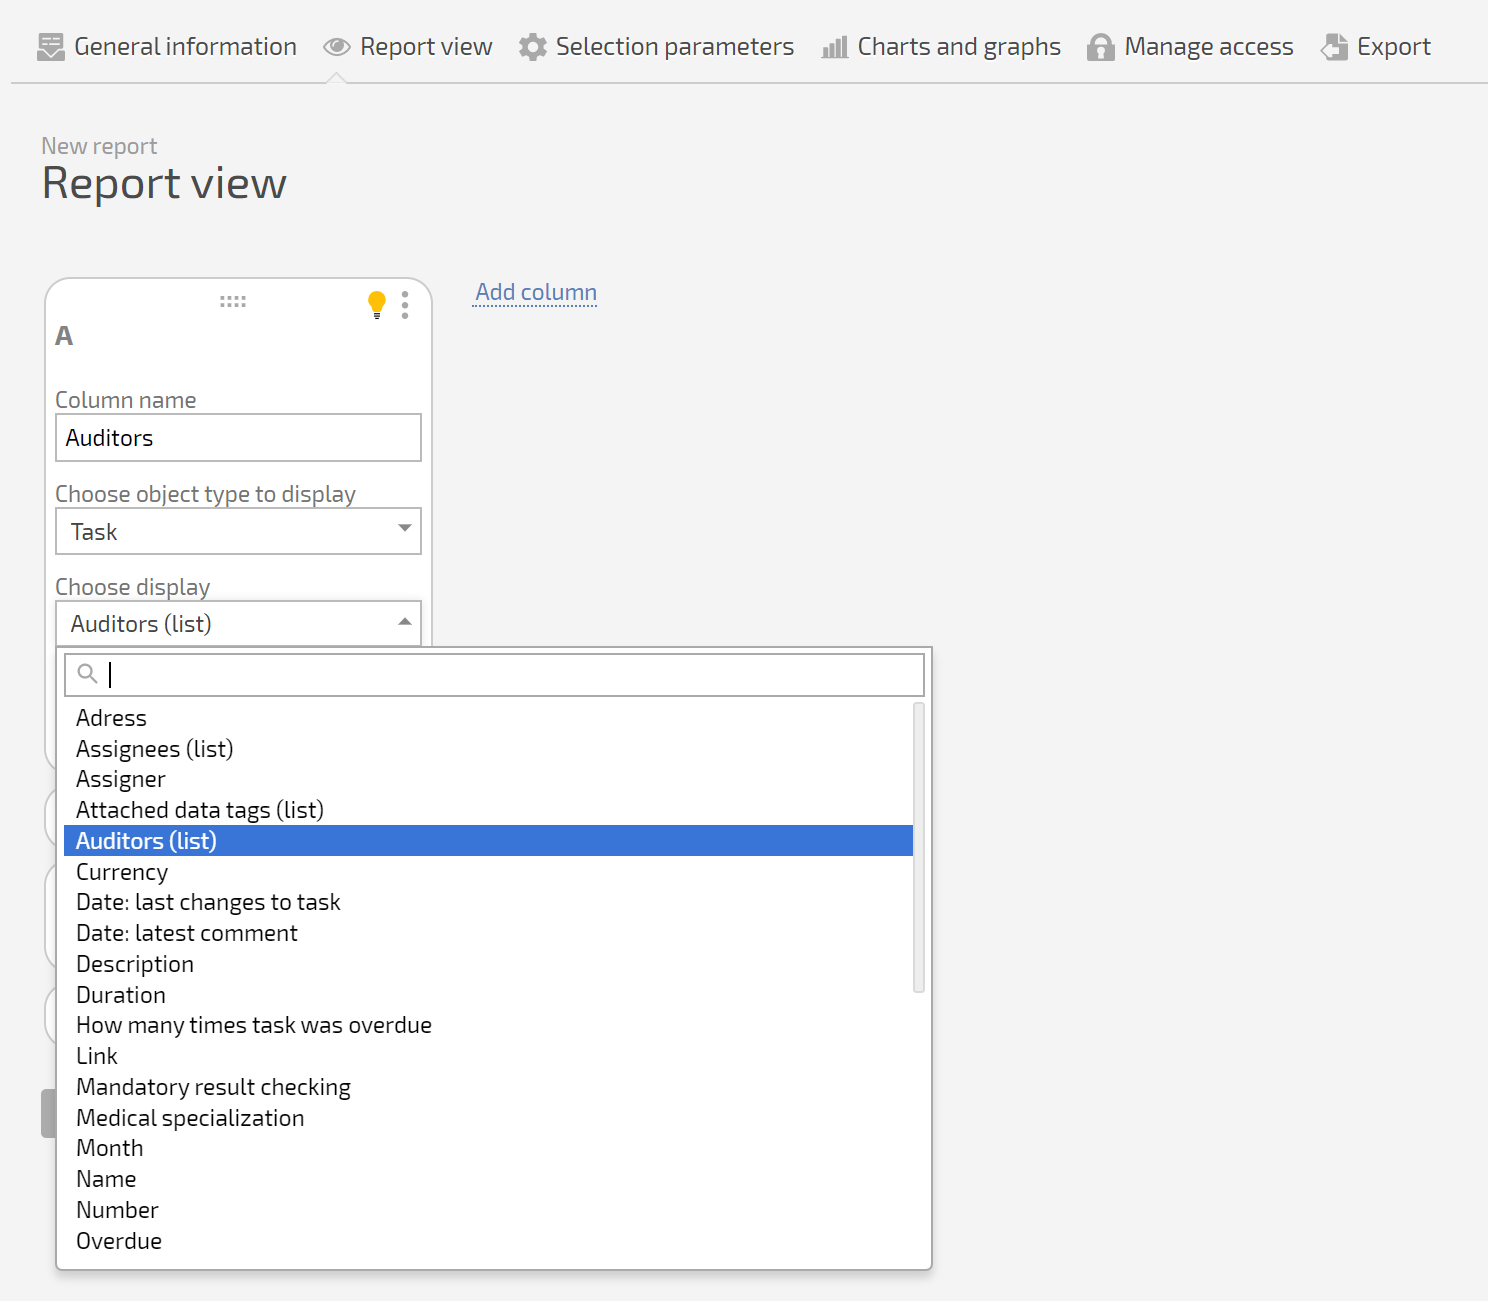
Note: when you choose a Data tag object for a column, you must set the display parameters for each data tag in the selection.
Using formulas
One of the object types available for column output is Formula. You can read more about using this type of object in our help article on Formulas.
Final report view
In the end, you get a set of columns, which will determine how the report looks and what data it will show:
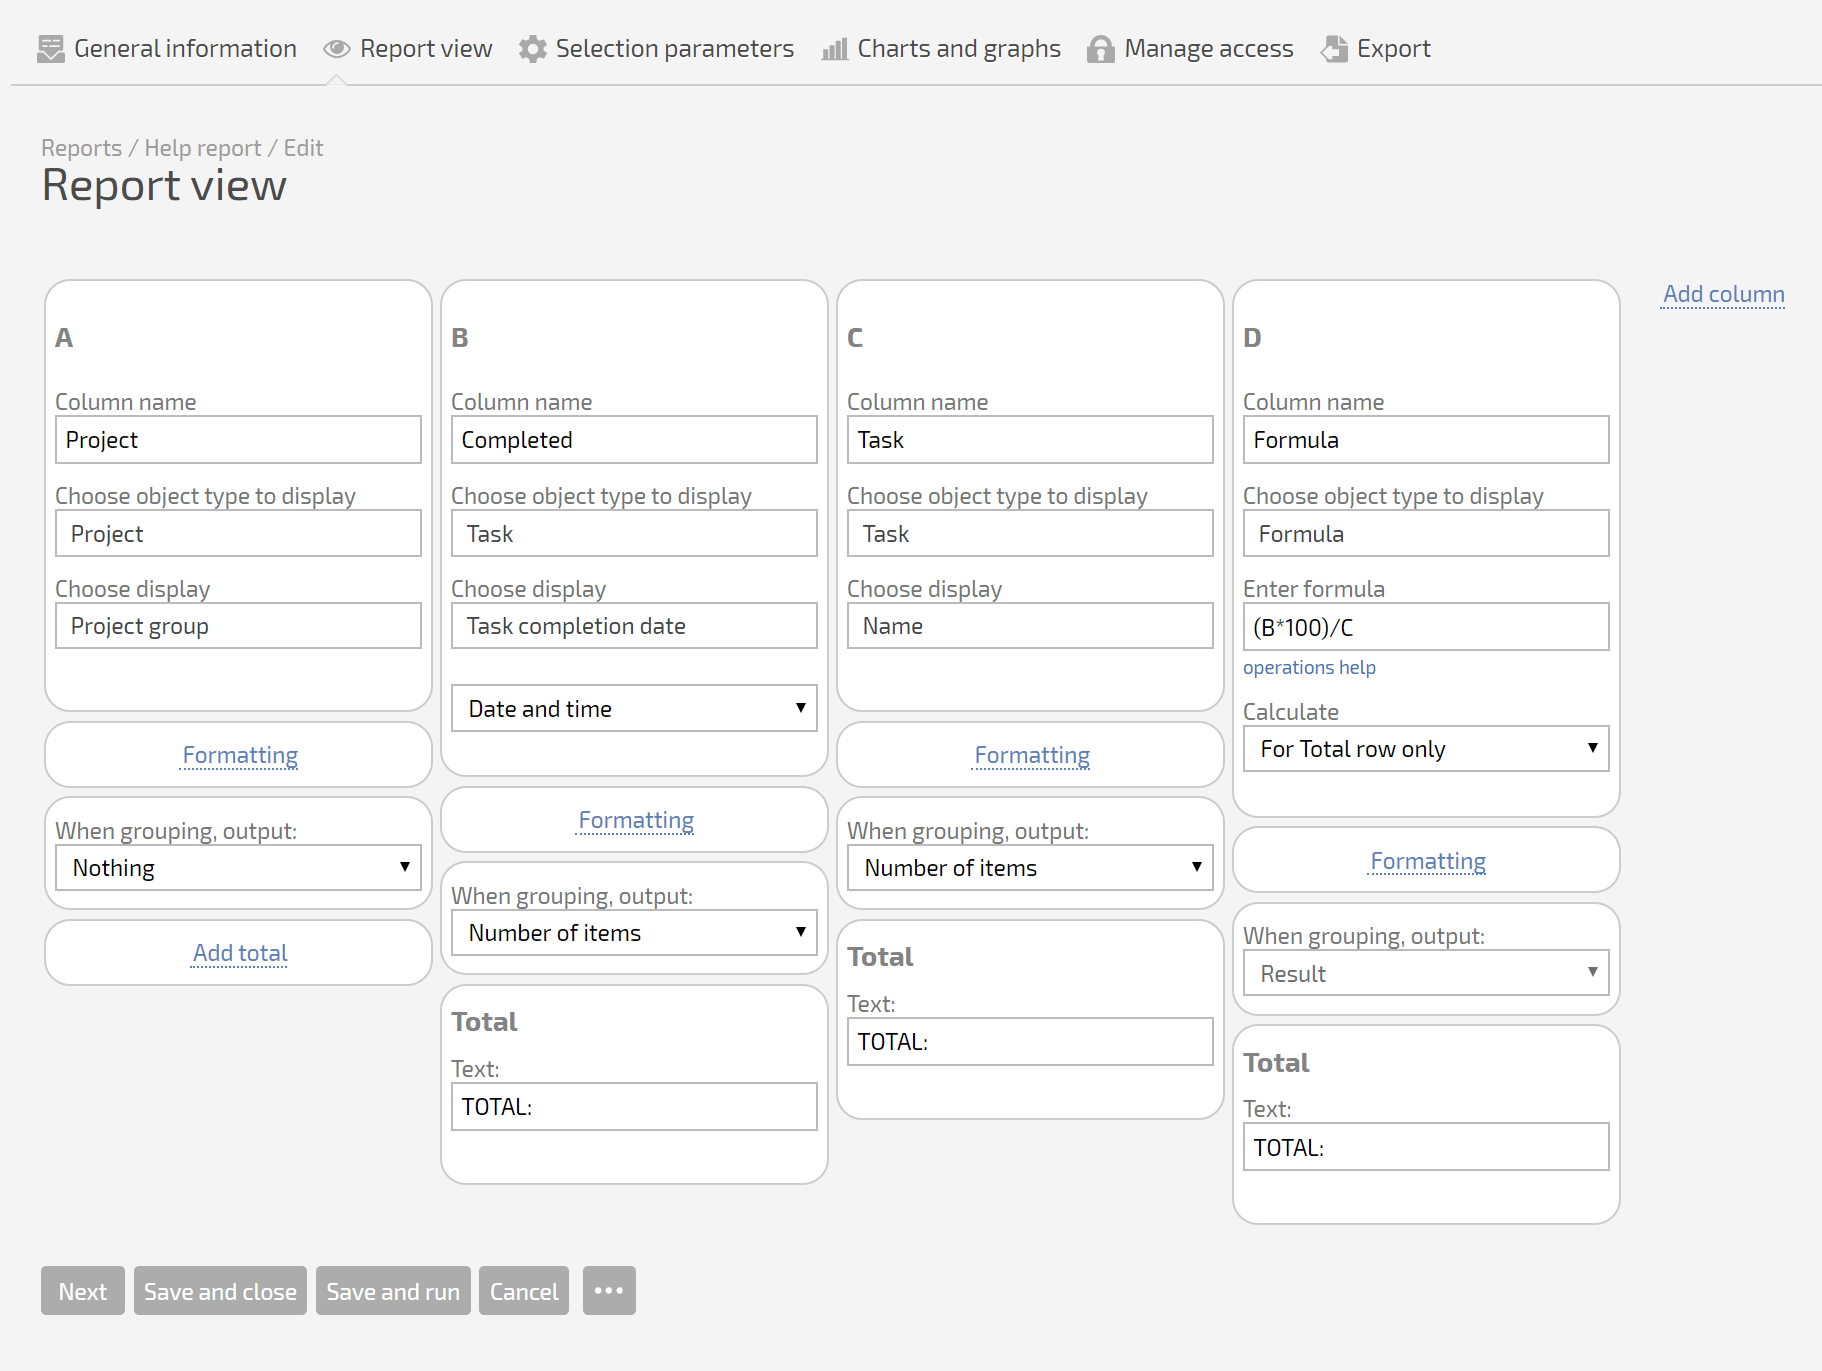
You can save or launch a report right from the settings window. You can also analyze the resulting data or go back to editing mode to make adjustments to the report.