Switching display type: Difference between revisions
From Planfix
No edit summary |
No edit summary |
||
| Line 4: | Line 4: | ||
*as a chronicle | *as a chronicle | ||
*as a Gantt chart | *as a Gantt chart | ||
*as a location | *as a location. | ||
Latest revision as of 05:37, 21 January 2021
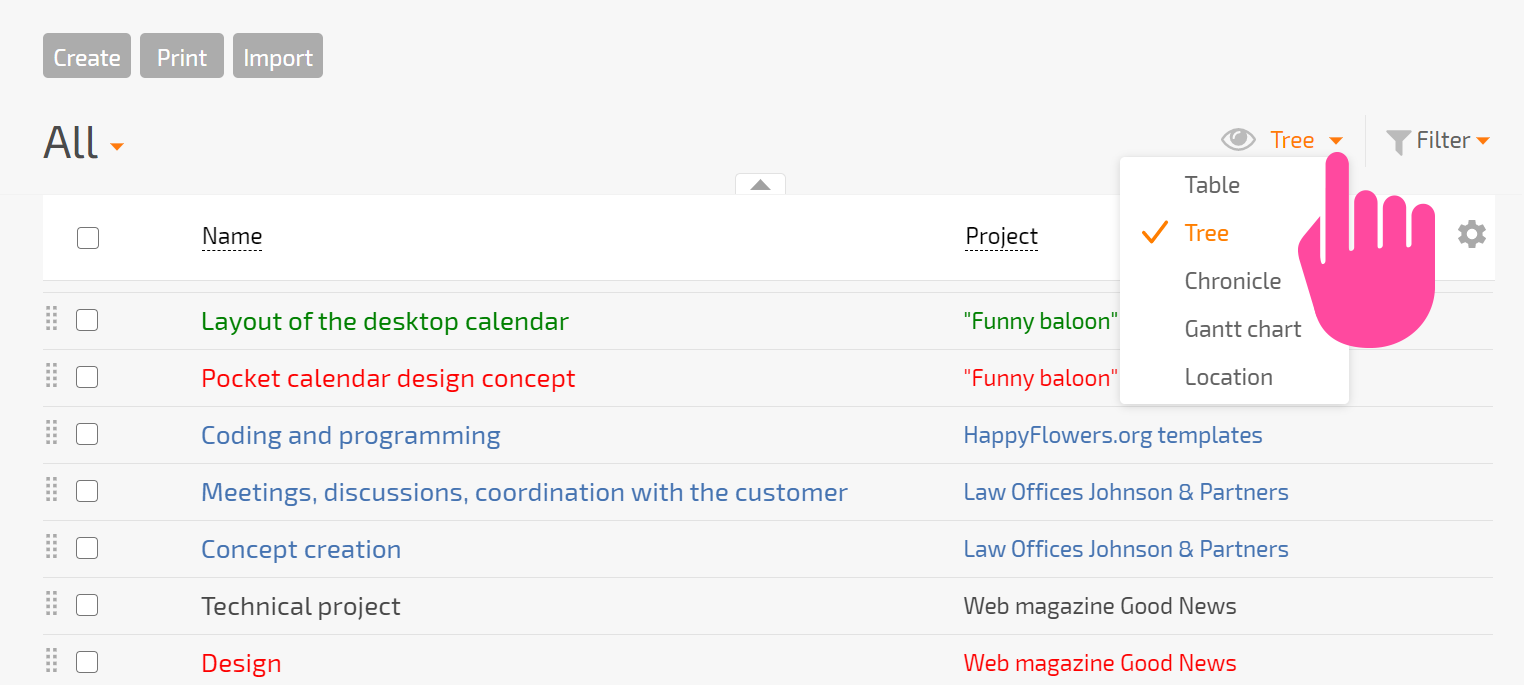
There are different ways to display the task list in the "Tasks" section:
- as a table
- as a tree
- as a chronicle
- as a Gantt chart
- as a location.
You can switch views using the designated element located above the tools panel.
- Table view lets you see all the task data you need as columns in a table. You can configure the contents of these columns.
- Tree view differs from table view in that it allows you to see the hierarchical nesting of tasks (subtasks) as a tree.
- Chronicle view lets you see tasks broken out by related events. You can read more about the Chronicle here.
- Gantt chart display shows the selected tasks as a Gantt chart.
- Location shows your tasks on a map. For this to work, tasks must contain a Location field with address information linked to a map.
Switching between display options in other Planfix sections works similarly. The views available in each section depending on the section's purpose.