Reports for Internal Projects and Tasks Solution: Difference between revisions
From Planfix
No edit summary |
No edit summary |
||
| (7 intermediate revisions by 2 users not shown) | |||
| Line 10: | Line 10: | ||
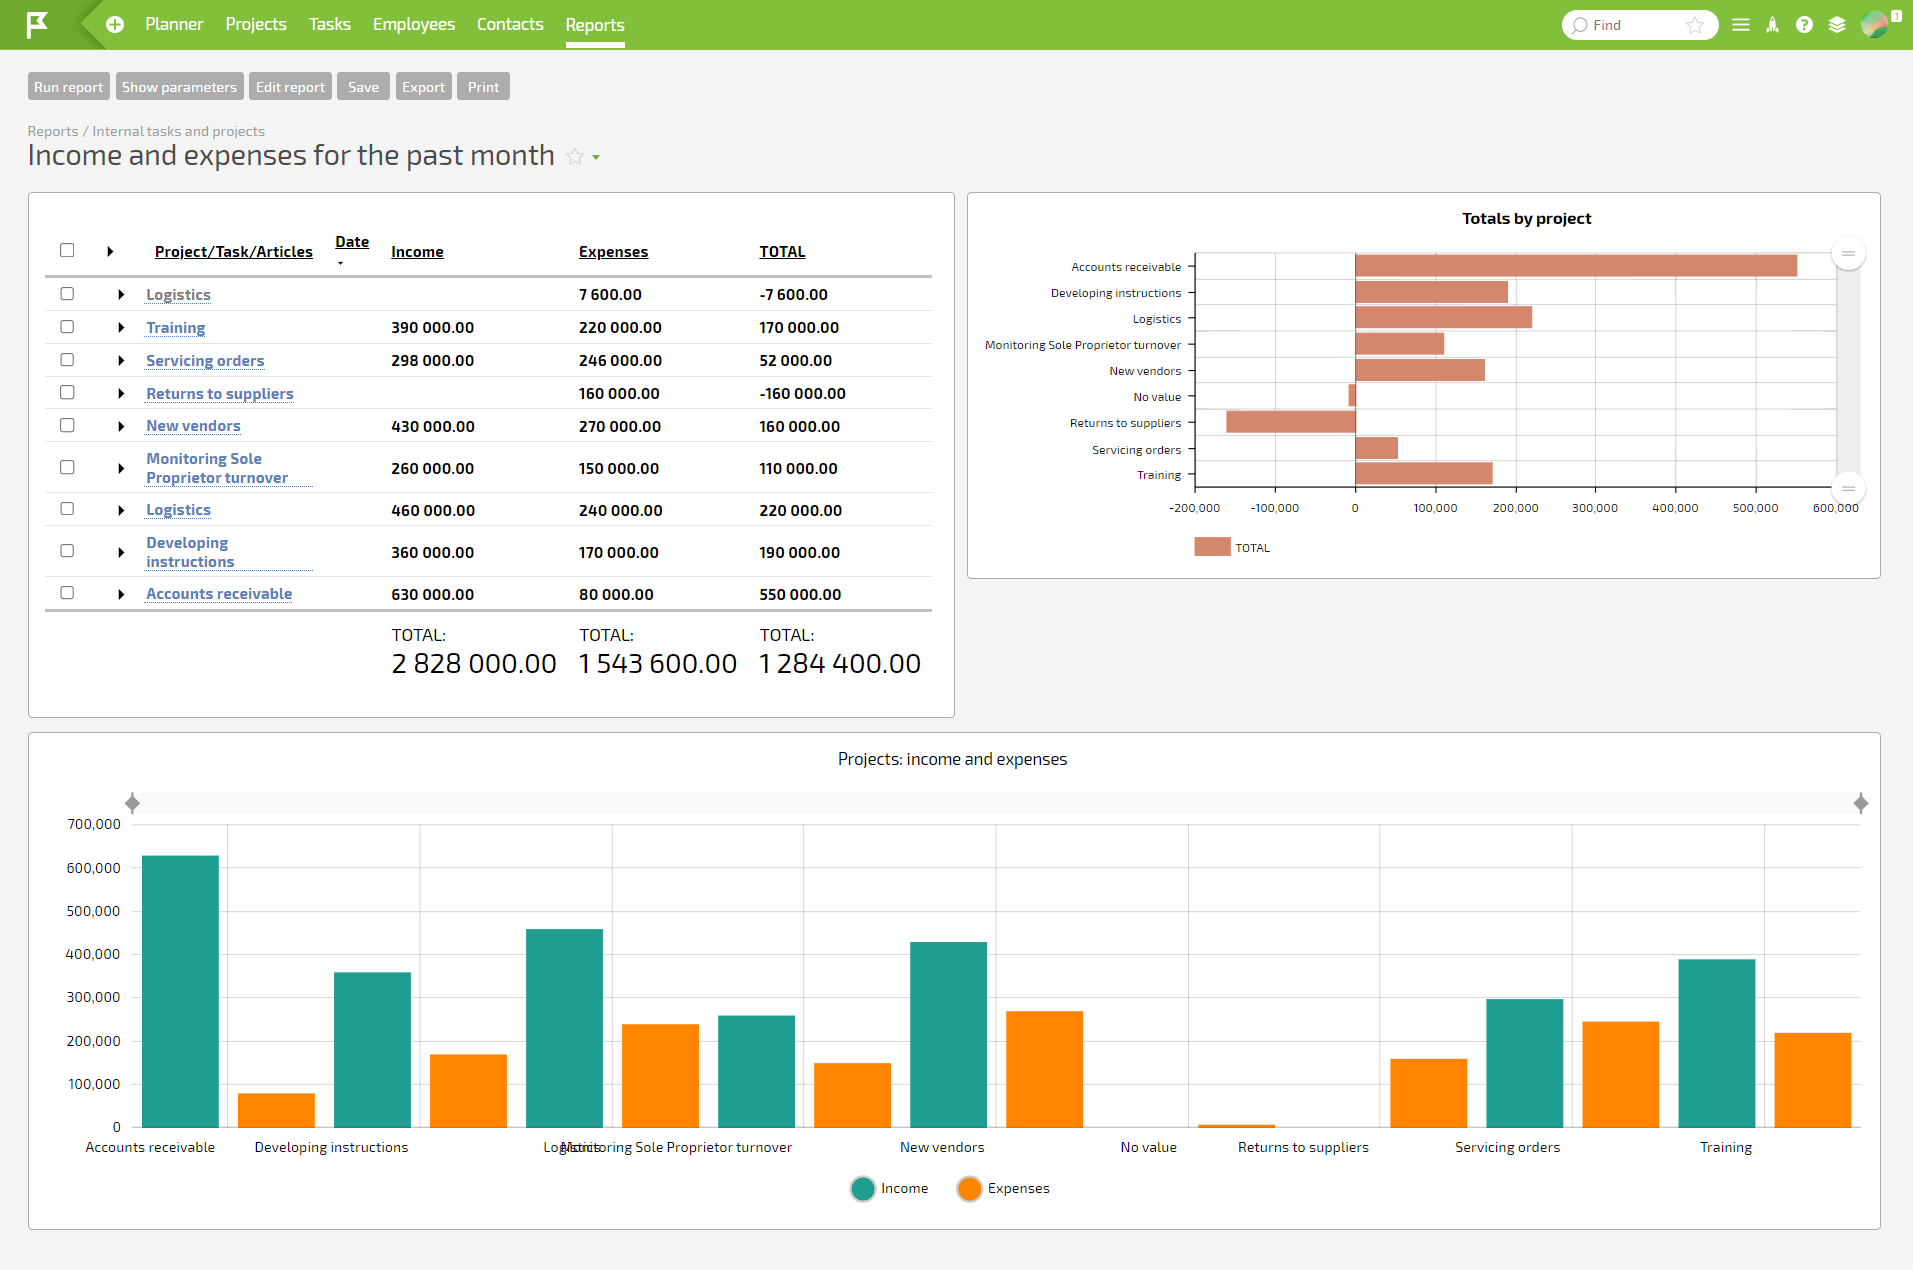
*'''Income and Expenses For the Last Month''': This report overviews your income and expenses. The right chart shows the difference between income and expenses for each project. At the same time, the bottom chart lets you visually assess the ratio of income to expenses for each project. | *'''Income and Expenses For the Last Month''': This report overviews your income and expenses. The right chart shows the difference between income and expenses for each project. At the same time, the bottom chart lets you visually assess the ratio of income to expenses for each project. | ||
https://s.pfx.so/pf/rd/aZoKE9.png | |||
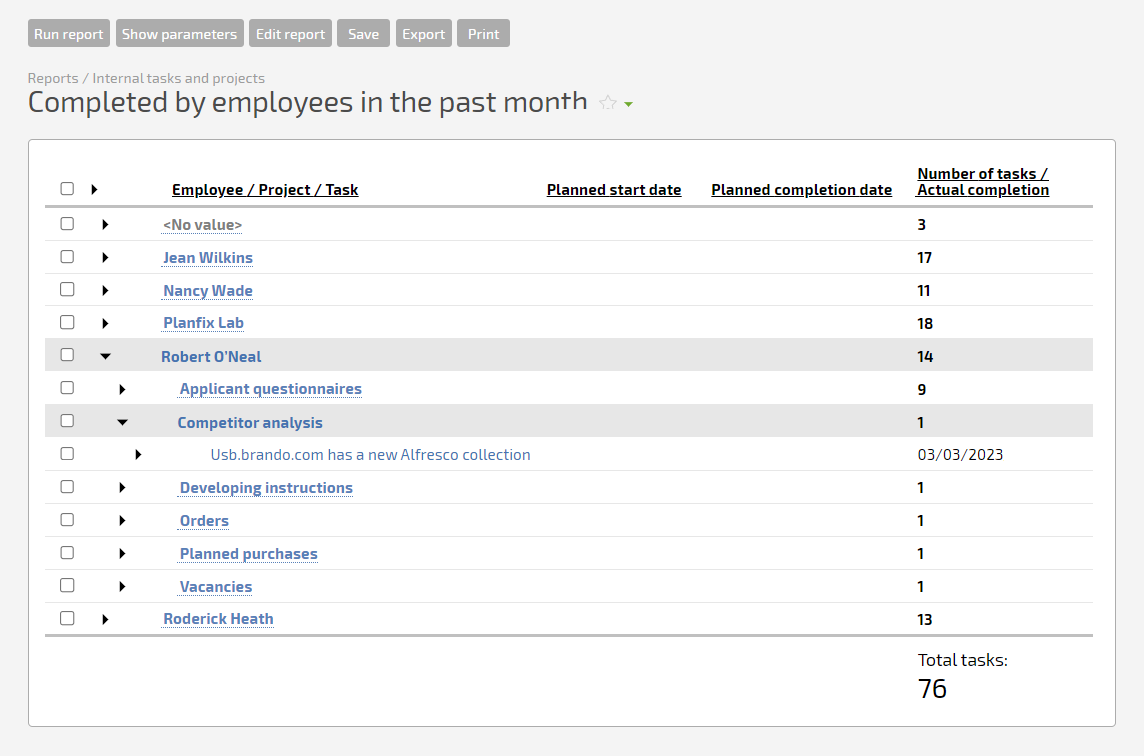
*'''Tasks Completed by Employees In the Last Month''': This report shows the number of tasks completed by each employee in each project in the last month. It also shows the due dates for each task. | *'''Tasks Completed by Employees In the Last Month''': This report shows the number of tasks completed by each employee in each project in the last month. It also shows the due dates for each task. | ||
https://s.pfx.so/pf/kH/zsRKpm.png | |||
With these reports, you can create other [[How to create a new report? | custom reports]] that consider specific indicators in your company. | |||
== Go To == | |||
*[[How to restore the default settings - Internal Projects and Tasks Solution | How to restore the default settings]] | |||
*[[Internal Projects and Tasks Solution]] | |||
*[[Ready-made Solutions]] | |||
Latest revision as of 13:26, 28 February 2025
The Internal Projects and Tasks Solution now includes several custom reports that you can use to track different aspects of your projects.
Here are two examples:
- Income and Expenses For the Last Month: This report overviews your income and expenses. The right chart shows the difference between income and expenses for each project. At the same time, the bottom chart lets you visually assess the ratio of income to expenses for each project.

- Tasks Completed by Employees In the Last Month: This report shows the number of tasks completed by each employee in each project in the last month. It also shows the due dates for each task.

With these reports, you can create other custom reports that consider specific indicators in your company.
