Reports: configuring data tag display
The main guideline for outputting data from a data tag in reports is: One report row can contain only one data tag entry. However, the need often arises to output data from several data tags in one report. Let's take the simple Planned/Actual report as an example. For each day, this report outputs:
- planned working time;
- actual working time;
- the difference between the two.
The result of executing this report looks as follows (fragment):
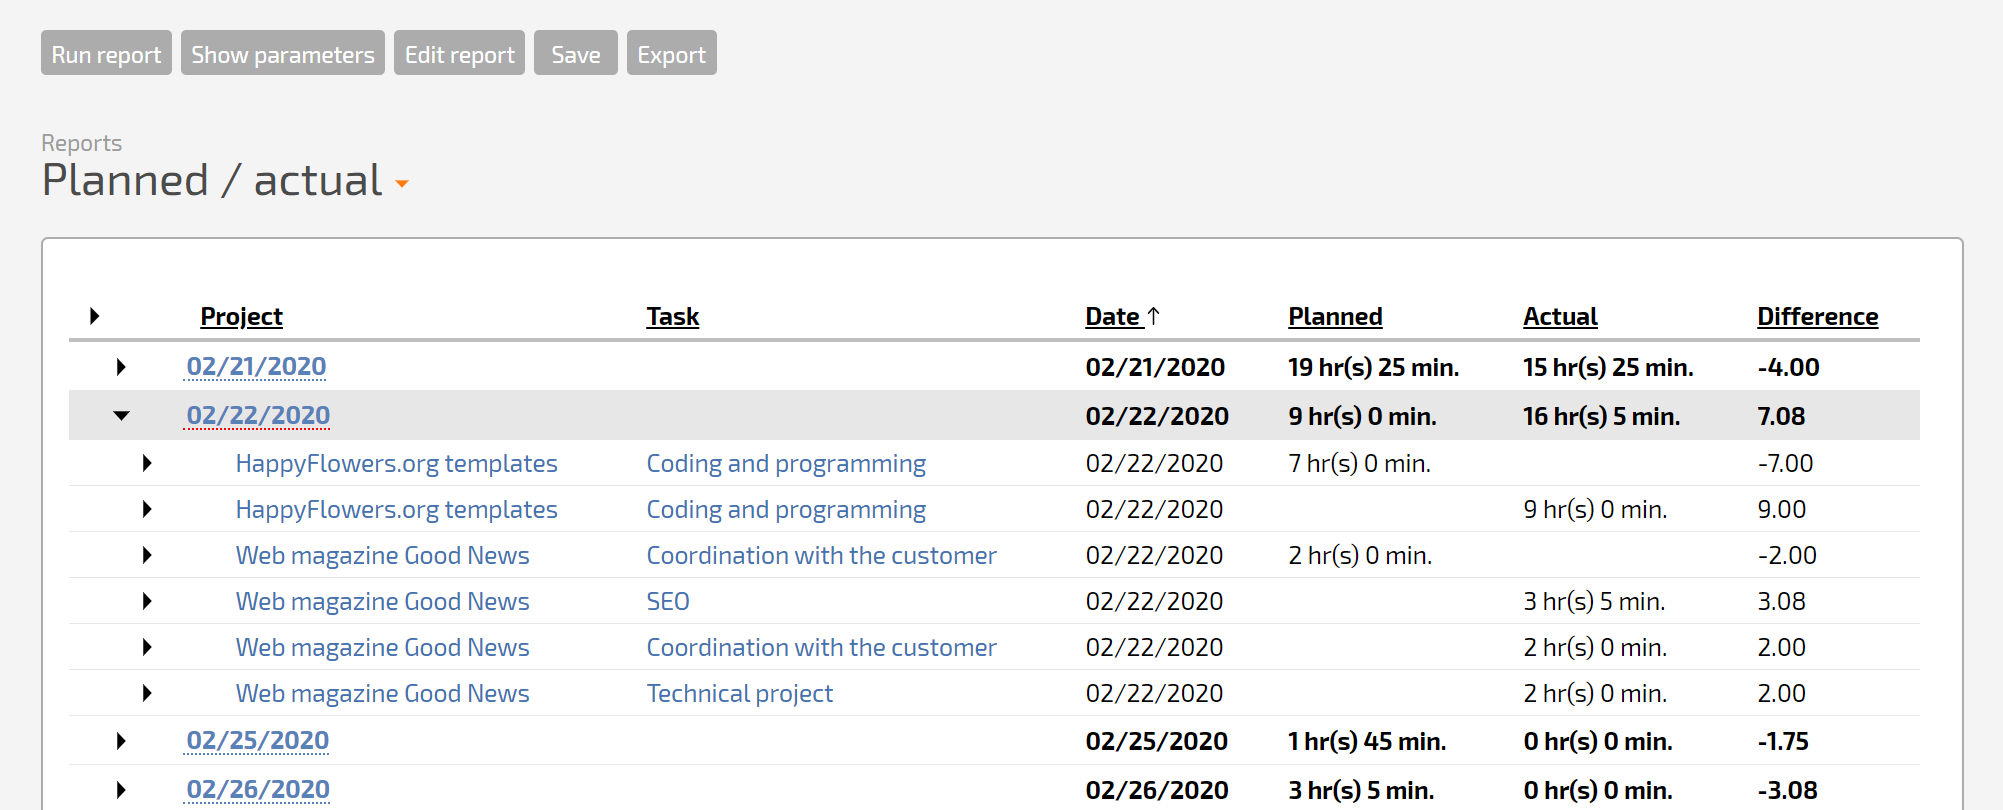
In the resulting view, we can see that the final numbers are gathered from data tag entries: each row contains one data tag entry from Planned working time or Actual working time. It's clear to see that each of these data tags goes in either the Planned or Actual columns.
Here's what the settings for these report columns look like:
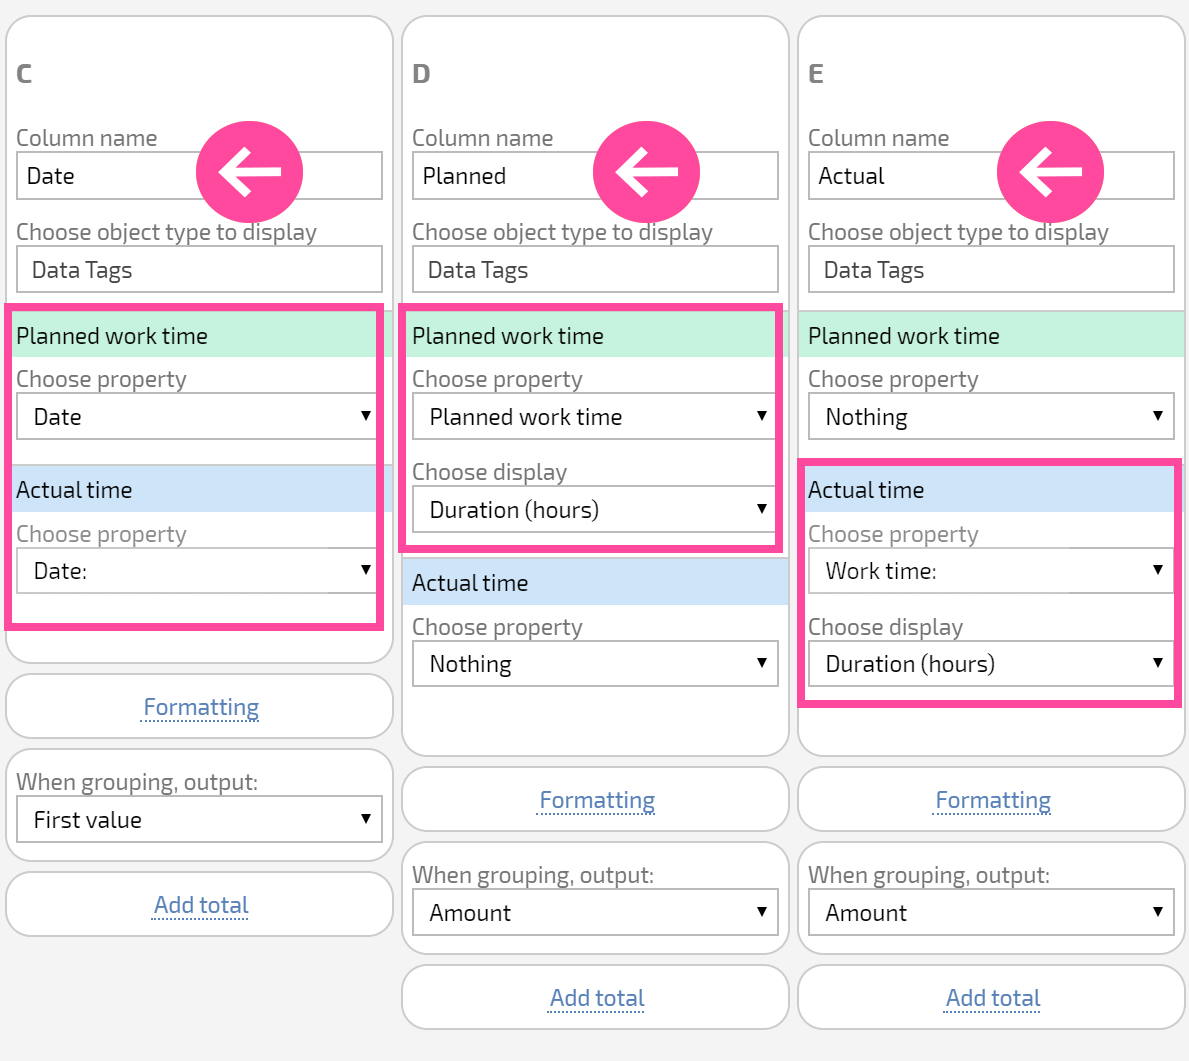
Note the blocks highlighted in red. Here's how Planfix interprets these settings:
- In the Planned column, data is displayed from the Planned working time data tag, and nothing is displayed in this column for rows with the data tag Actual working time.
- In the Actual column, data is displayed from the Actual working time data tag, and nothing is displayed in this column for rows with the data tag Planned working time.
Now, look at the block highlighted in green for the Date column settings. In this column, data is presented for both the Planned working time and Actual working time data tags. In both cases, these are data tag fields that are called "Date" and indicate the date the data tag entered belongs to. This approach allows you to group data from different data tags and get collapsed data: in one row, we can see summary data by planned and actual time spent working.
The example described illustrates a rule that you need to incorporate when creating reports that contain several data tags: Data from multiple data tags can only be displayed in one line of a report if you deliberately group them.
The Date column in the example described is an example of this kind of deliberate grouping:
- corresponding fields in each data tag are selected;
- they are displayed in one column;
- this column has grouping.